📈 🚀
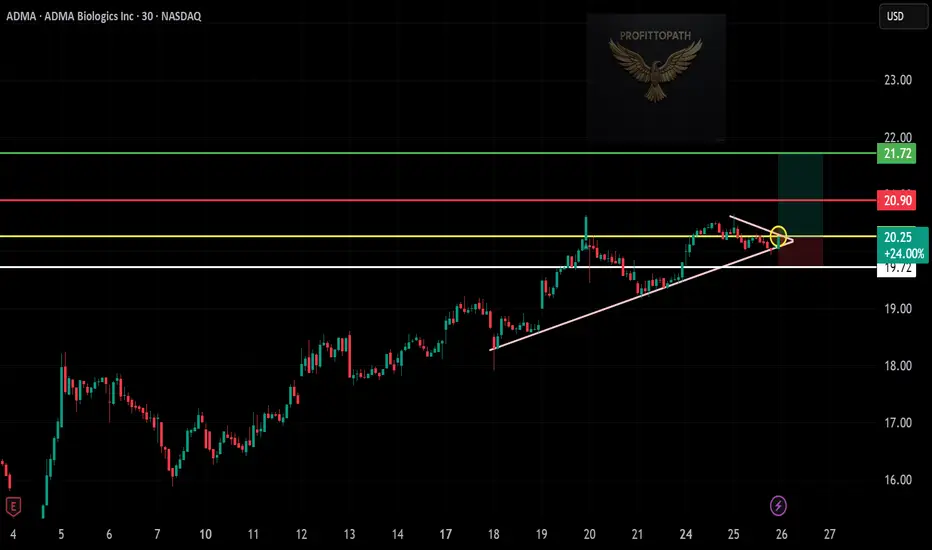
🔹 Asset: ADMA (NASDAQ)
🔹 Timeframe: 30-Min Chart
🔹 Setup Type: Trendline Support + Falling Wedge Breakout
📊 Trade Plan (Long Position)
✅ Entry Zone: Above $20.30 (breakout confirmation above wedge resistance)
✅ Stop-Loss (SL): Below $19.72 (below trendline and key structure)
🎯 Take Profit Targets
📌 TP1: $20.90 – Minor resistance & last swing high
📌 TP2: $21.72 – Major resistance / profit-taking zone
📊 Risk-Reward Ratio Calculation
📉 Risk:
$20.30 - $19.72 = $0.58 risk per share
📈 Reward to TP1:
$20.90 - $20.30 = $0.60 (1.03:1 R/R)
📈 Reward to TP2:
$21.72 - $20.30 = $1.42 (2.44:1 R/R)
🔍 Technical Analysis & Strategy
📌 Falling Wedge: Price consolidating with higher lows and lower highs, signaling potential breakout
📌 Trendline Support: Strong base holding since March 18th — bullish structure intact
📌 Volume Observation: Watch for a pop in volume as confirmation of breakout
📌 Yellow Zone: Mid-level area reclaiming previous resistance turned support
⚙️ Trade Execution & Risk Management
📊 Entry Confirmation: 30-min candle close above $20.30
📉 SL Strategy: Place SL below trendline at $19.72
🔁 Trailing Stop Strategy:
✔ SL to breakeven at TP1
✔ Trail above $20.60 toward TP2
💰 Profit Booking Strategy
✔ Take 50% profit at TP1 = $20.90
✔ Hold remaining toward TP2 = $21.72
✔ Raise SL progressively to secure profits
⚠️ Setup Invalid Conditions
❌ Breakdown below $19.72 invalidates trend and wedge
❌ Avoid entry without bullish close above wedge
🚀 Final Thoughts
✔ Great trendline support + falling wedge = strong technical confluence
✔ Breakout from yellow zone can trigger a quick move toward $21+
✔ Clean, well-structured long setup with 2.4:1 potential R/R
Disclaimer
The information and publications are not meant to be, and do not constitute, financial, investment, trading, or other types of advice or recommendations supplied or endorsed by TradingView. Read more in the Terms of Use.
Disclaimer
The information and publications are not meant to be, and do not constitute, financial, investment, trading, or other types of advice or recommendations supplied or endorsed by TradingView. Read more in the Terms of Use.