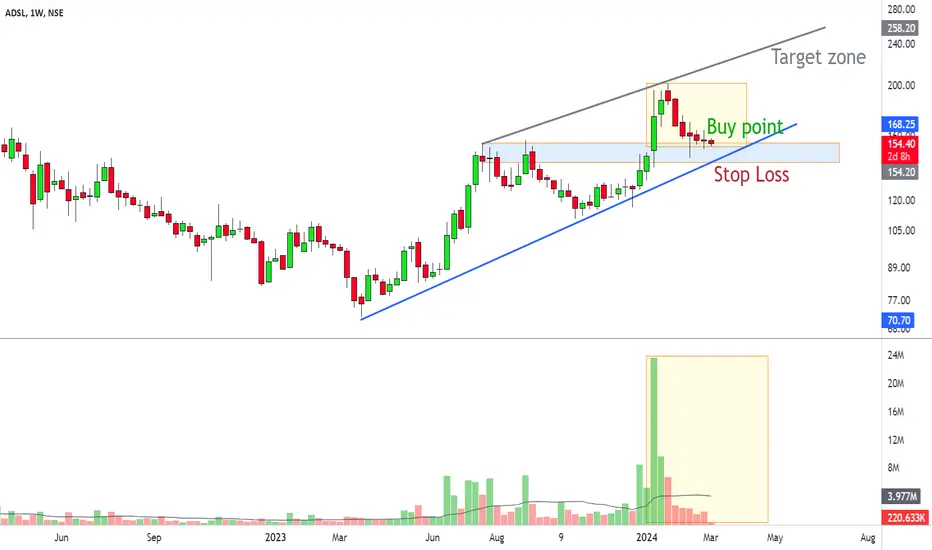
ADSL-WEEKLY CHART - Classical Flag Pattern at Strong Support zone with Volume Divergence also. Pullback at very low volume and Seller is getting tired with weak candles waiting for strong Green candle to buy the stock.
Buy zone = 150-160
Stop loss = 139
Target = 210-220
time horizon = 5-10 Weeks
Reason = Flag pattern at strong support zone with weak sellers and volume.
Buy zone = 150-160
Stop loss = 139
Target = 210-220
time horizon = 5-10 Weeks
Reason = Flag pattern at strong support zone with weak sellers and volume.
Disclaimer
The information and publications are not meant to be, and do not constitute, financial, investment, trading, or other types of advice or recommendations supplied or endorsed by TradingView. Read more in the Terms of Use.
Disclaimer
The information and publications are not meant to be, and do not constitute, financial, investment, trading, or other types of advice or recommendations supplied or endorsed by TradingView. Read more in the Terms of Use.