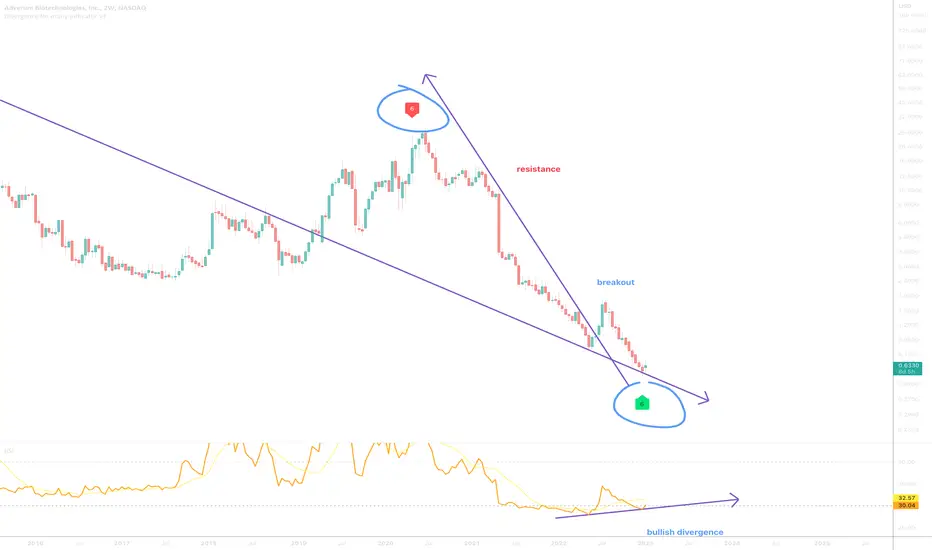
On the above bi-Weekly chart price action has corrected over 90% since June 2020. A number of reasons now exist to be bullish , including:
1) A strong buy signal prints (not shown).
2) Regular bullish divergence . Multiple oscillators printing divergence.
3) Price action confirms support on past resistance.
4) Falling wedge breakout + backtest.
Is it possible price action falls further? Sure.
Is it probable? No.
Ww
Type: trade
Risk: <=6% of portfolio
Timeframe: Don’t know.
Return: Don’t know
Stop loss: <= 50 cents
Trade active
Note
support confirmedTrade active
GRM support confirmed.Note
50% return so far. Hold until the resistance @ 7 dollars.Trade active
GRM support confirmed three times now. More bullish than a bull on steroids running on a moving treadmill chasing a slow moving red flag.Note
230% return so far? Time to sell... If only there was a way to tell.Trade active
BTC
bc1q2eckdzh0q8vsd7swcc8et6ze7s99khhxyl7zwy
Weblink: patreon.com/withoutworries
Allow 3-6 months on ideas. Not investment advice. DYOR
bc1q2eckdzh0q8vsd7swcc8et6ze7s99khhxyl7zwy
Weblink: patreon.com/withoutworries
Allow 3-6 months on ideas. Not investment advice. DYOR
Disclaimer
The information and publications are not meant to be, and do not constitute, financial, investment, trading, or other types of advice or recommendations supplied or endorsed by TradingView. Read more in the Terms of Use.