Long
AdEx Another 100% UP
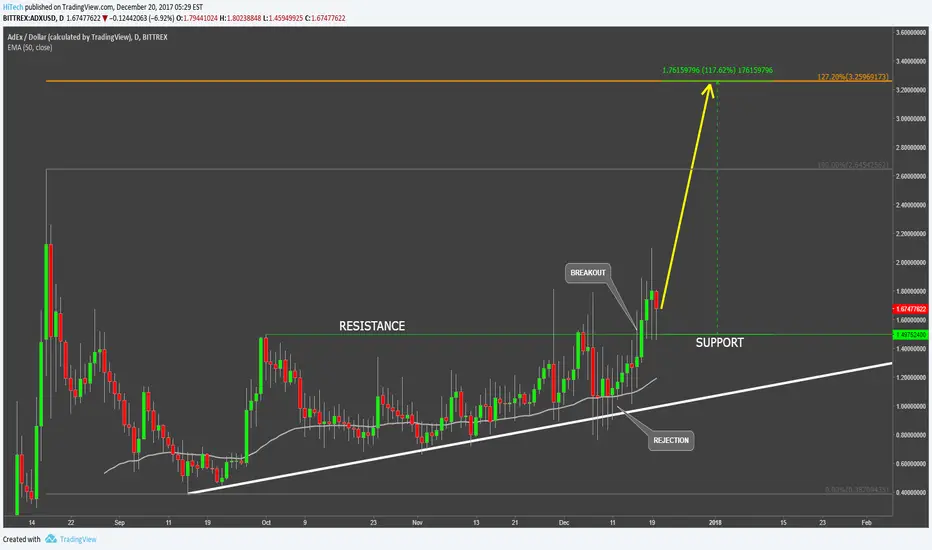
AdEx finally managed to break above the resistance at $1.5, that has been established back in October. There were few attempts to break above that level, but only on the 17th of December price closed above.
Prior to that ADX/USD bounced off the uptrend trendline and the 50 Moving Average on the Daily chart. In addition, it started to produce higher highs and higher lows, suggesting that the uptrend is about to start.
The nearest upside target is seen at 127.2% Fibonacci applied through the all-time high, and that is at $3.25. This is a 100% growth potential for AdEx in a relatively short period of time. Break above that resistance will confirm a longer-term uptrend, while rejection should result in a corrective wave down. Only a close below the 50 Moving Average could invalidate bullish outlook.
Note
Has it started? :)Note
looking goodNote
looking even betterTrade closed: target reached
yahooooooNote
Update, Adex VS Bitcoin 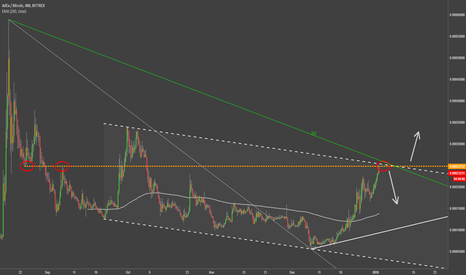
Disclaimer
The information and publications are not meant to be, and do not constitute, financial, investment, trading, or other types of advice or recommendations supplied or endorsed by TradingView. Read more in the Terms of Use.
Disclaimer
The information and publications are not meant to be, and do not constitute, financial, investment, trading, or other types of advice or recommendations supplied or endorsed by TradingView. Read more in the Terms of Use.