🔍 Chart Overview & Pattern Analysis
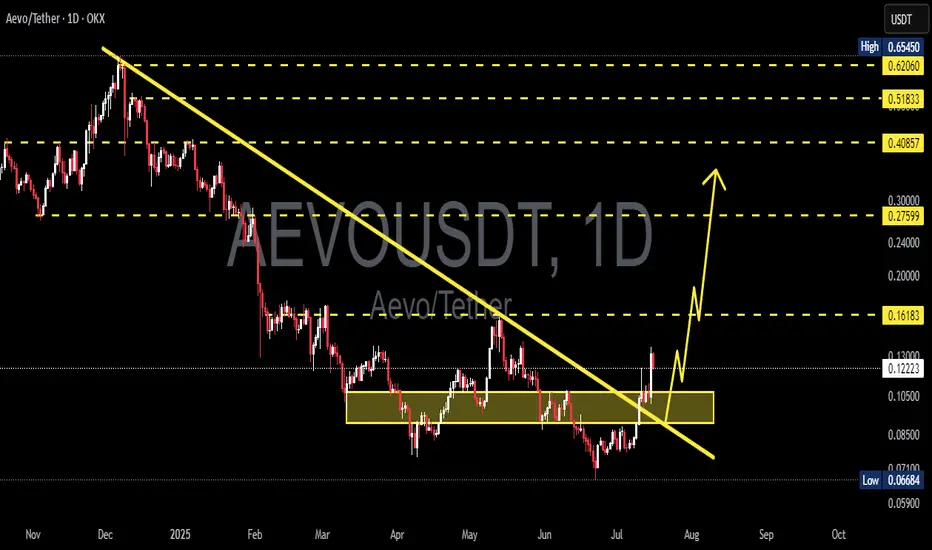
The AEVO/USDT daily chart reveals a significant breakout from a long-term descending trendline that has been intact since November 2024. This trendline acted as a strong dynamic resistance, suppressing every bullish attempt—until now.
A clear multi-month accumulation zone is visible between $0.080 – $0.105 (highlighted in yellow). Price tested this support zone multiple times, forming a strong base of demand. The combination of horizontal support and descending resistance creates a classic descending triangle breakout, often signaling a trend reversal when broken to the upside.
What's more, price action recently:
Broke above the trendline with strong bullish candles
Retested the breakout zone successfully
Is now forming a potential bullish continuation structure (mini bull flag or pennant)
This structure suggests that the bulls are not done yet—and momentum could be accelerating.
🟢 Bullish Scenario – The Path to Higher Highs
If AEVO continues to hold above the breakout zone, the following upside targets become very realistic:
✅ Target 1: $0.16183 – Previous resistance zone, short-term TP.
✅ Target 2: $0.27599 – Key horizontal resistance from late Q1 2025.
✅ Target 3: $0.40857 – Weekly structure resistance.
✅ Target 4: $0.51833 – Bullish extension zone.
🎯 Ultimate Bull Target: $0.62660 – Full recovery to pre-downtrend levels.
Confluence factors supporting this bullish outlook:
Breakout above dynamic and static resistances
Accumulation breakout after long consolidation
Higher low and bullish retest pattern
Bullish momentum building with volume confirmation (volume not shown but implied)
🔴 Bearish Scenario – Key Levels to Watch
In case of a false breakout or macro weakness:
Breakdown below $0.105 could invalidate the bullish structure
Price could revisit $0.080 or even $0.06684 (last line of defense)
A daily close below this zone would shift the bias back to bearish or neutral
However, as long as price stays above the yellow support box, the bullish thesis remains valid.
---
🧠 Key Technical Highlights
Pattern: Descending Triangle Breakout + Accumulation Base
Trend Shift: From Bearish to Bullish (confirmed with breakout + retest)
Momentum: Building up toward higher time frame resistances
Market Psychology: Smart money likely accumulated during sideways chop
📣 Final Thoughts
AEVO/USDT is showing one of the cleanest breakout structures in the altcoin space right now. With clear upside targets, a retested breakout zone, and strengthening market structure, this could be the early phase of a major bullish leg.
Traders and investors should watch for confirmation of higher highs and pullbacks to the $0.105 zone for potential entries.
#AEVOUSDT #CryptoBreakout #TrendReversal #AltseasonReady #DescendingTriangle #CryptoTA #BullishCrypto #AltcoinAnalysis #TechnicalBreakout #AEVOAnalysis
✅ Get Free Signals! Join Our Telegram Channel Here: t.me/TheCryptoNuclear
✅ Twitter: twitter.com/crypto_nuclear
✅ Join Bybit : partner.bybit.com/b/nuclearvip
✅ Benefits : Lifetime Trading Fee Discount -50%
✅ Twitter: twitter.com/crypto_nuclear
✅ Join Bybit : partner.bybit.com/b/nuclearvip
✅ Benefits : Lifetime Trading Fee Discount -50%
Disclaimer
The information and publications are not meant to be, and do not constitute, financial, investment, trading, or other types of advice or recommendations supplied or endorsed by TradingView. Read more in the Terms of Use.