Long
AGIBTC Bottomed out | Falling wedge extremely Bullish
check daily chart below
AGIBTC is now at very important point from here it can go up so
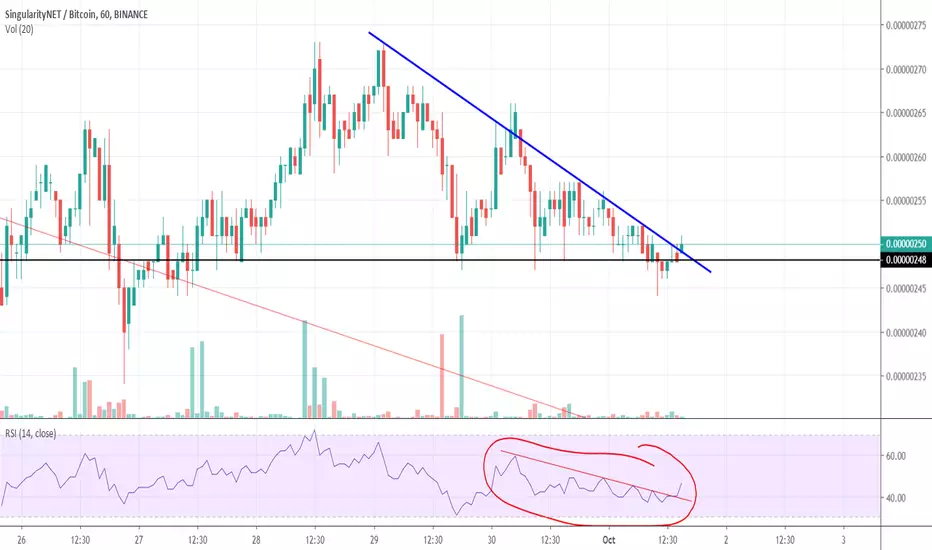
The black line you see in chart is the horizontal breakout line
so where we are right now
-> we are above this line and 1 hour forms a bullish wedge so taking support on the line and if bounced it can go higher
see 1 day chart

see 4 hour chart

bounce expected from here it can pump very high don't miss this coin just because it's on support ( dead cat bounce doesn't matter but this can pump from here
Buy : 240 - 250
stop loss : 5%
target : 5 to 40%
AGIBTC is now at very important point from here it can go up so
The black line you see in chart is the horizontal breakout line
so where we are right now
-> we are above this line and 1 hour forms a bullish wedge so taking support on the line and if bounced it can go higher
see 1 day chart
see 4 hour chart
bounce expected from here it can pump very high don't miss this coin just because it's on support ( dead cat bounce doesn't matter but this can pump from here
Buy : 240 - 250
stop loss : 5%
target : 5 to 40%
Disclaimer
The information and publications are not meant to be, and do not constitute, financial, investment, trading, or other types of advice or recommendations supplied or endorsed by TradingView. Read more in the Terms of Use.
Disclaimer
The information and publications are not meant to be, and do not constitute, financial, investment, trading, or other types of advice or recommendations supplied or endorsed by TradingView. Read more in the Terms of Use.