Long
SingularityNET (AGIX) - bullish divergence
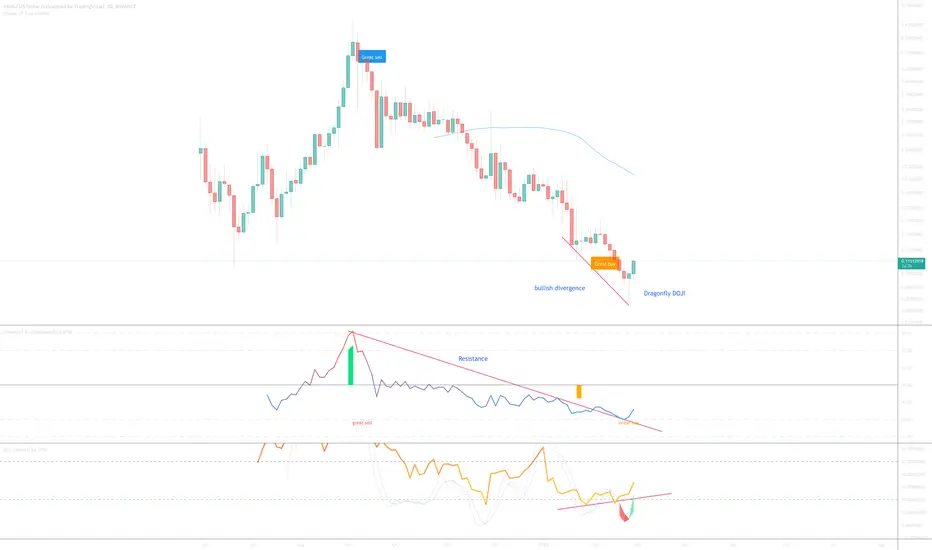
On the above 3-day chart price action has corrected over 80% since early September following the ‘great sell’ signal. Now is an excellent time to be bullish. Why?
1) A ‘great buy’ signal prints.
2) Regular bullish divergence has printed between the oscillators and price action.
3) A dragonfly DOJI candle prints. Fantastic.
4) RSI resistance breakout.
5) The 2-day BTC pair prints a ‘incredible buy’ signal with multiple oscillators showing bullish divergence (below).
Is it possible price action falls further? For sure.
Is it probable? No.
1st target: 50 cents.
Good luck!
Ww
2-day AGIX/BTC divergence
Note
There's about 12 hours until this 10-day chart prints a new candle. However if it closes as it is now it will be like rocket fuel to price action.Note
The above candle was confirmed. Fantastic.Note
IB prints on 5-day day.Trade active
Note
Forgot to share the chart above... not trying to time market bottoms, but when I do...Note
Bearish divergence on the daily following a 'great sell' signal.Look for support on the 50-day SMA.
Trade active
This would be a good moment to close swings trades since the bearish divergence above. Why?1) On the daily price action has corrected to the golden ratio.
2) On the 8hr and 12hr time frames a ‘incredible buy’ signal has printed:
Trade active
Trade active
Trade active
For anyone still following this one there's a strong bullish divergence printing on the BTC pair with multiple oscillators and volume. Someone knows something I don't, as always.Note
PS: that's a 2-day chart.Trade active
BTC
bc1q2eckdzh0q8vsd7swcc8et6ze7s99khhxyl7zwy
Weblink: patreon.com/withoutworries
Allow 3-6 months on ideas. Not investment advice. DYOR
bc1q2eckdzh0q8vsd7swcc8et6ze7s99khhxyl7zwy
Weblink: patreon.com/withoutworries
Allow 3-6 months on ideas. Not investment advice. DYOR
Disclaimer
The information and publications are not meant to be, and do not constitute, financial, investment, trading, or other types of advice or recommendations supplied or endorsed by TradingView. Read more in the Terms of Use.