Short
SingularityNET (AGIX) - 40% correction??
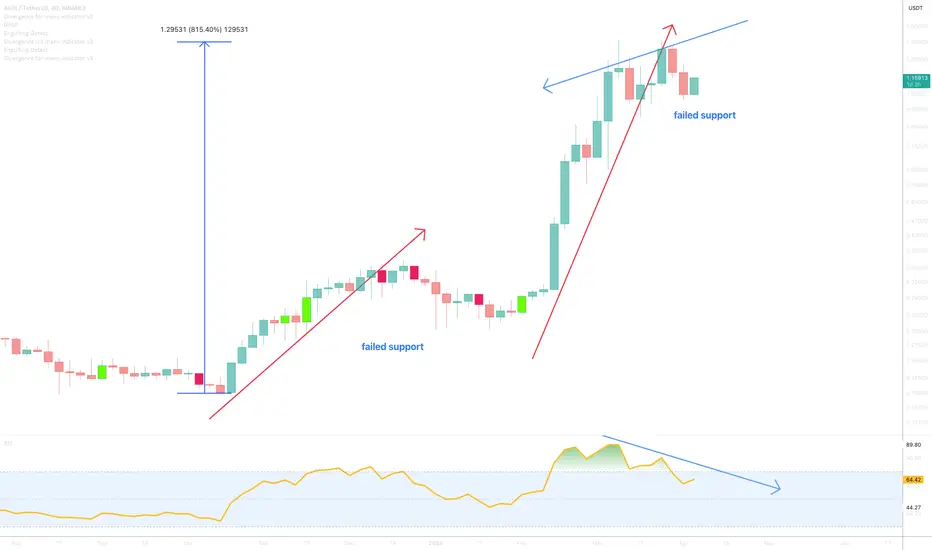
On the above 4 day chart price action has risen 800% since last October. A number of reasons now exist to be short, including:
1) Price action support has failed.
2) Regular bearish divergence. This negative divergence can also be found on the BTC pair of the token (below).
3) Price action is following the Gaussian channel after a strong rally as shown on the daily chart below. This is bearish. If you notice price action entering the channel it is very likely to test the lower side of the channel, currently a 40% correction away.
Is it possible price action continues up? Sure.
Is it probable? No
Ww
AGIX.BTC negative divergence

Gaussian channel support

1) Price action support has failed.
2) Regular bearish divergence. This negative divergence can also be found on the BTC pair of the token (below).
3) Price action is following the Gaussian channel after a strong rally as shown on the daily chart below. This is bearish. If you notice price action entering the channel it is very likely to test the lower side of the channel, currently a 40% correction away.
Is it possible price action continues up? Sure.
Is it probable? No
Ww
AGIX.BTC negative divergence
Gaussian channel support
Trade active
Past support confirms resistance.Note
30% correction so far.Trade active
Price action fails to hold 3-day/50-SMA support. Look left to know what happens next ;-)Trade active
Only another 26% to go until target Trade closed: target reached
A the red mist descends the bulls finally capitulate.Price action is certainly oversold at the moment but is not a long opportunity until confirmation of support on past resistance, which is 50 cents. Failure means a further 50% correction to 25 cents. There is no buy signal at this time.
Weekly
Note
A strong buy signal printed recently.Watch for market structure building price action around 80 cents in late July.
This would confirm the bull flag with a impulsive move to 3.70
2 day
BTC
bc1q2eckdzh0q8vsd7swcc8et6ze7s99khhxyl7zwy
Weblink: patreon.com/withoutworries
Allow 3-6 months on ideas. Not investment advice. DYOR
bc1q2eckdzh0q8vsd7swcc8et6ze7s99khhxyl7zwy
Weblink: patreon.com/withoutworries
Allow 3-6 months on ideas. Not investment advice. DYOR
Disclaimer
The information and publications are not meant to be, and do not constitute, financial, investment, trading, or other types of advice or recommendations supplied or endorsed by TradingView. Read more in the Terms of Use.