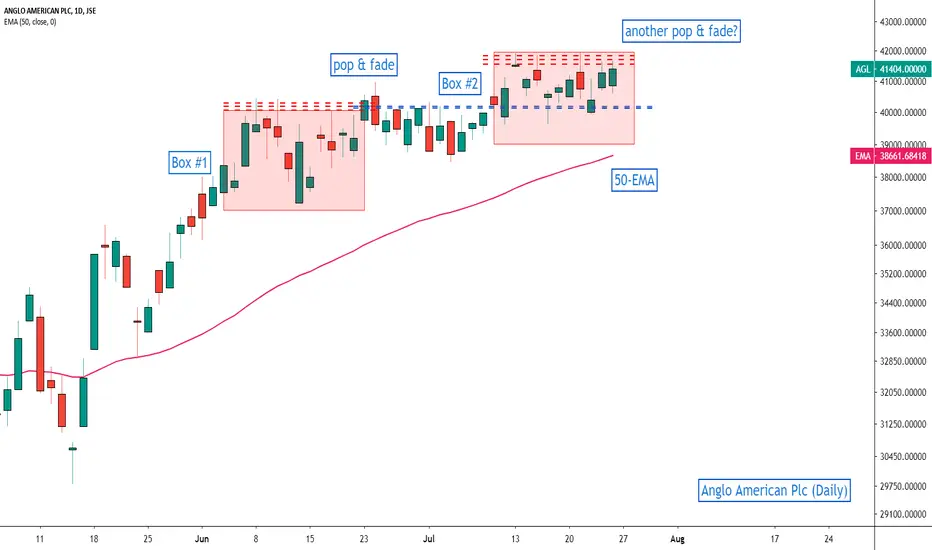
Anglo American Plc | With all prospective opportunities, we always want to remain open-minded to potential moves. More importantly, we want to be prepared to take action based on potential setups. A review of the short term (daily) chart for AGL sees the price in an upward trend but encountering selective selling at the R415 to R418 level. This consolidation zone (Box #2) appears quite similar to the prior consolidation period (Box #1) where we saw a brief breakout of the consolidation range followed by a reversal candle and subsequently trend lower. Could this again be the case over the next few trading sessions for the share where a 'pop' above R420 is follow by a 'fade'? Alternatively, the 50-day EMA (currently at ~R387.00-R389.00) may provide an opportunity on the buy/long side.
Disclaimer
The information and publications are not meant to be, and do not constitute, financial, investment, trading, or other types of advice or recommendations supplied or endorsed by TradingView. Read more in the Terms of Use.
Disclaimer
The information and publications are not meant to be, and do not constitute, financial, investment, trading, or other types of advice or recommendations supplied or endorsed by TradingView. Read more in the Terms of Use.