AGX GROUP BERHAD
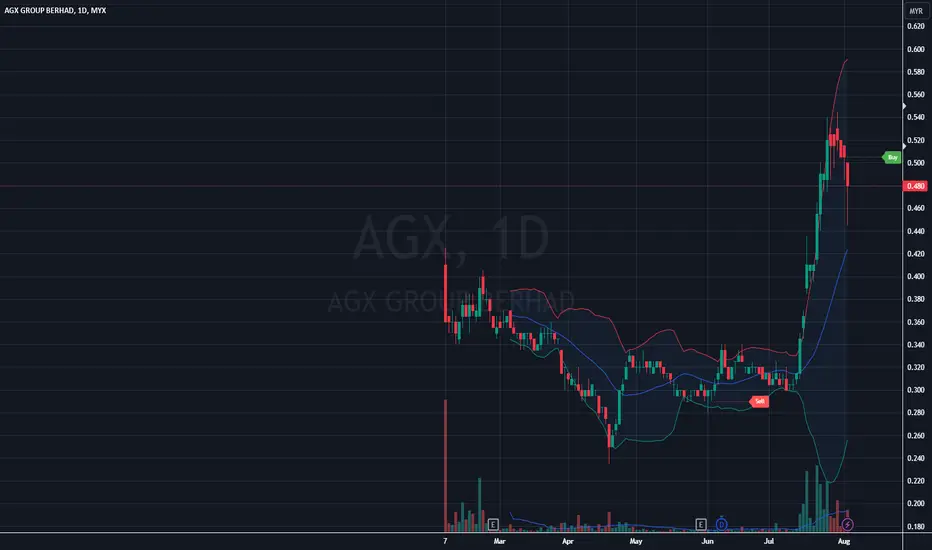
Overall, the stock shows a strong bullish trend but may be due for a short-term pullback or consolidation. Traders should watch for support levels holding and potential continuation of the uptrend, while also being cautious of potential reversals given the rapid recent gains.
- Trend: The stock has shown a strong upward trend recently, with a significant price increase from late July to early August.
- Support and Resistance: The current price seems to be encountering resistance around the 0.545 level (marked as "High" on the chart). Support levels could be around 0.480-0.500, based on recent price action.
- Moving Averages: Two moving averages are visible on the chart. The shorter-term MA (likely 20-day) has recently crossed above the longer-term MA (possibly 50-day), which is typically a bullish signal.
- Volume: There's been a notable increase in trading volume accompanying the recent price surge, indicating strong buying interest.
- Volatility: The stock has experienced increased volatility in recent days, with larger price swings and longer candlesticks.
- Candlestick Patterns: The most recent candle shows a bearish pattern, possibly indicating a short-term pullback or consolidation.
- Momentum: Despite the recent pullback, the overall momentum appears bullish based on the steepness of the recent uptrend.
- Bollinger Bands: While not explicitly shown, the recent price action suggests the stock may have been trading above its upper Bollinger Band, indicating overbought conditions.
Overall, the stock shows a strong bullish trend but may be due for a short-term pullback or consolidation. Traders should watch for support levels holding and potential continuation of the uptrend, while also being cautious of potential reversals given the rapid recent gains.
Trade closed: target reached
➀➁➂➃➄
Disclaimer
The information and publications are not meant to be, and do not constitute, financial, investment, trading, or other types of advice or recommendations supplied or endorsed by TradingView. Read more in the Terms of Use.
➀➁➂➃➄
Disclaimer
The information and publications are not meant to be, and do not constitute, financial, investment, trading, or other types of advice or recommendations supplied or endorsed by TradingView. Read more in the Terms of Use.