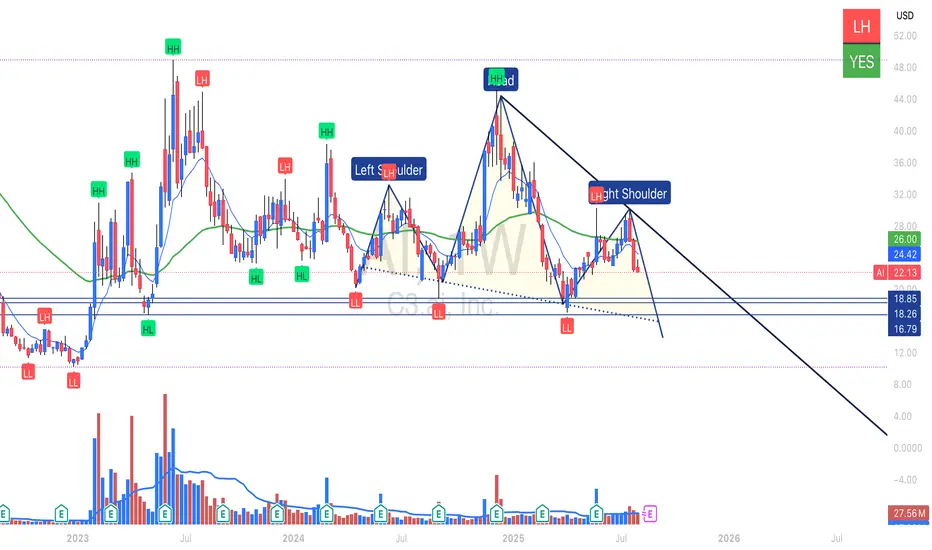
Weekly Chart Analysis
A clear Head & Shoulders pattern has formed with neckline support around the $18.80–$18.20 zone. Price failed to hold above the 50 & 200 EMA, breaking structure from Lower Highs. Volume confirms distribution. A decisive break below neckline could open downside targets toward $16.80 and potentially lower, aligning with the descending trendline projection
no pain, no gain
Unveiling illusions, revealing wealth
Unveiling illusions, revealing wealth
Disclaimer
The information and publications are not meant to be, and do not constitute, financial, investment, trading, or other types of advice or recommendations supplied or endorsed by TradingView. Read more in the Terms of Use.