I have been following this one for a week or so to see how low she will go. I am watching only due to lack of support at this time.
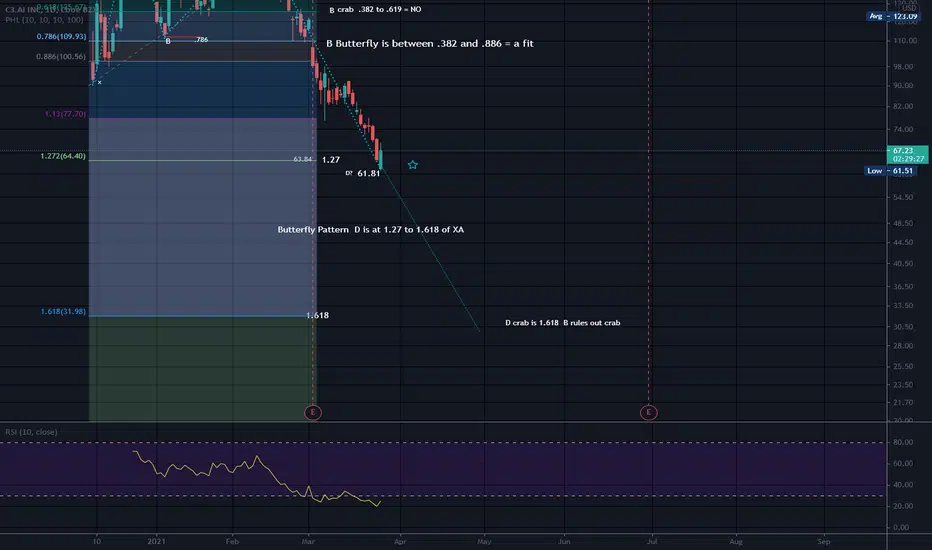
This looks like it is trying to form a butterfly pattern. When D is below X, you are possibly looking at a butterfly or a crab. The crab is ruled out at B as it pulled back close to the .786 of the XA leg. The shark also has D below X, but in the shark pattern, C is above A, so the shark is ruled out. Price can go to the 1.618 fib level according to the crab pattern. A cypher pattern and the crab are similar, but in the cypher pattern, CD pulls to the .786 of XA. I would not want to get the crab and the cyper confused with each other. )o:
You can begin figuring out which harmonic pattern you have at the end of the AB leg. After C completes, you can rule out more patterns.
The Gartley pulls back to the .618 on the AB leg. Some folks are more flexible, but D would not be below X.
Price has passed the 1.27 fib level by a few dollars. The butterfly has a CD leg that is 1.27% of the XA leg. There is no bottom forming as of yet. Price did accelerate after hitting the low of 61.81.
Until a bottom, or consolidation begins occurring at a specified level, I am not planning to trade this.
It can be a matter of deduction to figure out which harmonic pattern you are looking at. A matter of ruling out other patterns.
Negative Volume is low and short interest is over 7% depending on where you look. Price has been making a new low almost daily. There is no support to catch this one below price so would be difficult to place a stop. AI will have to form a bottom to pull in sellers when it reaches a level that makes folks become bullish.
This is one reason I do not like trading IPOs. There is a lack of support that years of trading can provide.
No recommendation
Note
Correction: Butterfly has a CD leg of 1.27 of the leg XA. Not 1.618. I wrote this on the chart and it is incorrect. Sorry, I thought I erased it and I can not change it now )o:Note
Another correction, form a bottom to pull in buyers..lol..not sellers (o:Disclaimer
The information and publications are not meant to be, and do not constitute, financial, investment, trading, or other types of advice or recommendations supplied or endorsed by TradingView. Read more in the Terms of Use.
Disclaimer
The information and publications are not meant to be, and do not constitute, financial, investment, trading, or other types of advice or recommendations supplied or endorsed by TradingView. Read more in the Terms of Use.