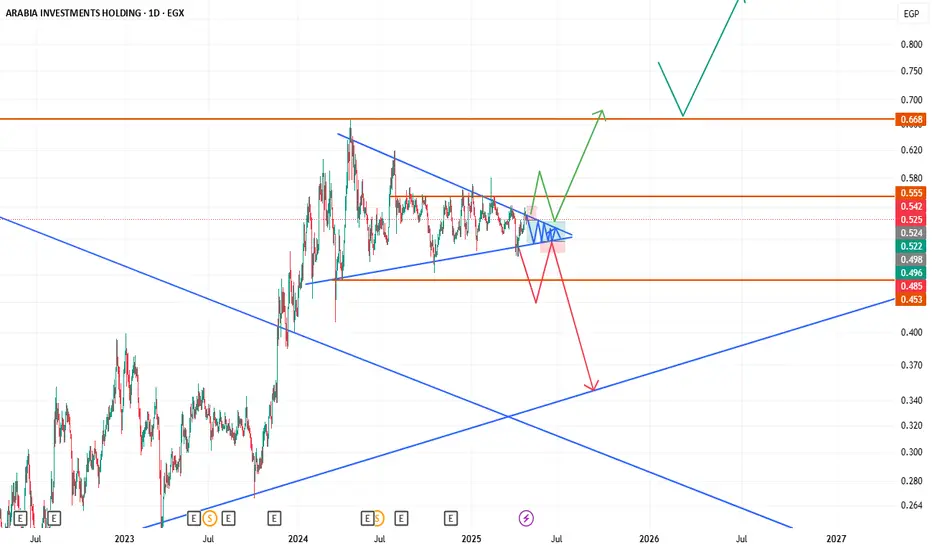
Ufff, What a chart man. This stock was in a downtrend for over 7 years. Then for a whole year is in this triangle as its accumulate. And so far it didnt take the liquidity @0.668, it did make an attempt, but failed. Then it will try again in the coming period.
I think to trade this one we should be patient as hell, as a one year accumulation, will definitely be followed by a manipulation then to the intended direction. When i say manipulation is the one as you see on 9, 10 of April.
For now i would take short trades between the triangle upper and lower legs. If the price breaks below 0.45, and closes below it, then we are testing the trendlines below, if it breaks above 0.55, then we will move higher to 0.668.
Do your own research. This is only a TA, NEWS is very important to be tracked alongside the TA.
Trade closed: target reached
Have updated the idea in another post, check it out if you want. Good chance that there is more gain in here than anticipated.
Disclaimer
The information and publications are not meant to be, and do not constitute, financial, investment, trading, or other types of advice or recommendations supplied or endorsed by TradingView. Read more in the Terms of Use.
Disclaimer
The information and publications are not meant to be, and do not constitute, financial, investment, trading, or other types of advice or recommendations supplied or endorsed by TradingView. Read more in the Terms of Use.