🟢
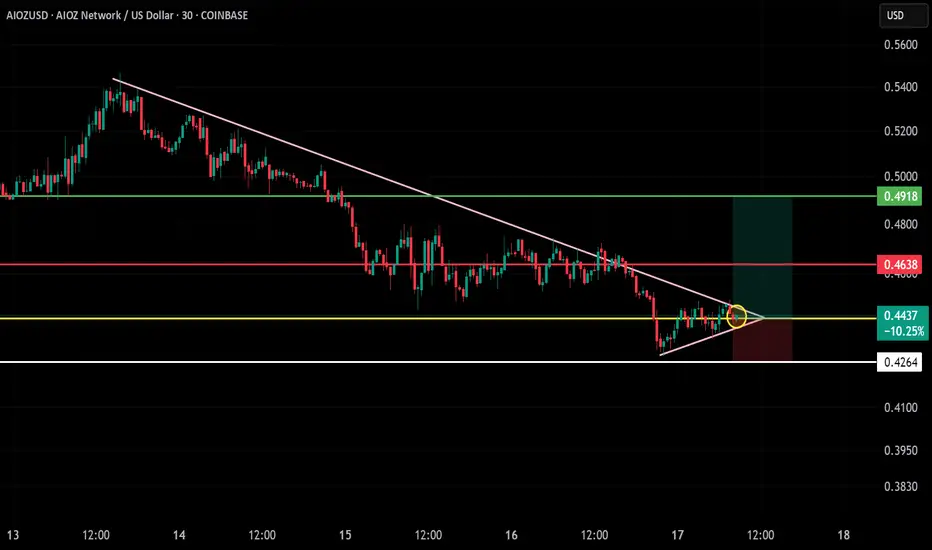
🔍 Pattern:
Symmetrical triangle breakout (bullish bias after a downtrend pause).
✅ Entry Zone:
Around $0.4437 (breakout point from triangle consolidation)
🔒 Stop-Loss (SL):
Below $0.4264 (recent swing low and horizontal support)
🎯 Take Profit (TP):
TP1: $0.4638 (minor resistance)
TP2: $0.4918 (major resistance level)
📈 Risk-Reward Ratio:
Approx. 1:2+, which is favorable for a long trade.
📊 Technical Notes:
Price is testing the upper triangle trendline.
Yellow circle marks a possible breakout candle.
Volume looks moderate but watch for an increase on breakout confirmation.
Disclaimer
The information and publications are not meant to be, and do not constitute, financial, investment, trading, or other types of advice or recommendations supplied or endorsed by TradingView. Read more in the Terms of Use.
Disclaimer
The information and publications are not meant to be, and do not constitute, financial, investment, trading, or other types of advice or recommendations supplied or endorsed by TradingView. Read more in the Terms of Use.
