🔍 Market Structure Overview
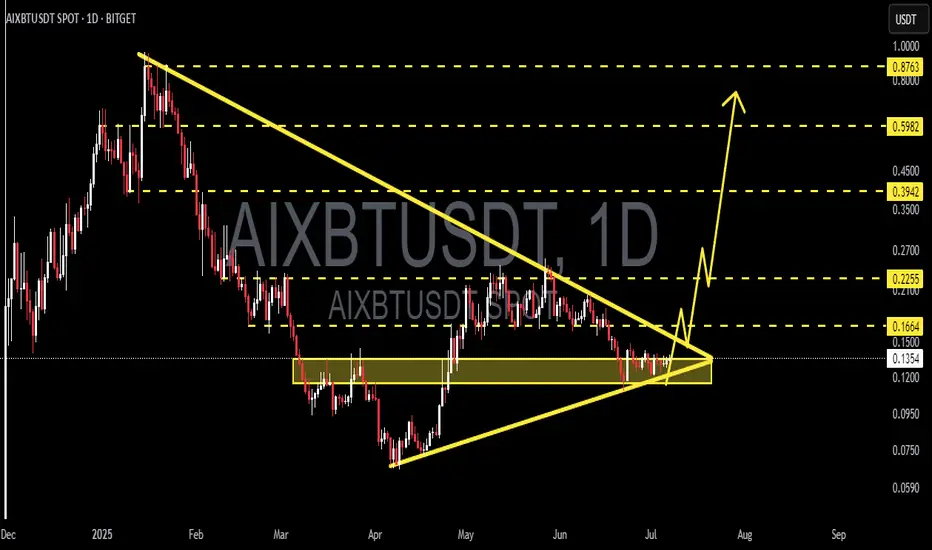
AIXBT/USDT is currently forming a well-defined Symmetrical Triangle pattern on the 1D timeframe, signaling a tightening consolidation between lower highs and higher lows.
Price is consolidating just above a strong demand zone between $0.1200–$0.1350, suggesting accumulation by smart money. This triangle formation represents a classic volatility squeeze, where price coils before a significant breakout or breakdown.
These setups are often the calm before the storm—and they typically lead to explosive moves once price escapes the pattern.
✅ Bullish Scenario (Breakout Upwards)
If price breaks above the descending trendline and clears the $0.1664 horizontal resistance level, it could ignite a powerful bullish run toward the following targets:
1. 🎯 Target 1: $0.2255 – Previous swing high & structural resistance.
2. 🎯 Target 2: $0.3942 – Strong horizontal resistance from historical price action.
3. 🎯 Target 3: $0.5982 – Mid-term Fibonacci/volume confluence level.
4. 🚀 Ultimate Target: $0.8763 – Psychological level and former macro resistance.
> Breakout Confirmation: Look for a daily candle close above the triangle with a surge in volume for confirmation.
❌ Bearish Scenario (Breakdown)
If bulls fail to break out and the price breaks down below the triangle and loses the $0.1200–$0.1349 support zone, the following downside targets come into play:
1. ⚠️ Support 1: $0.0950 – Previous local low.
2. ⚠️ Support 2: $0.0750 – A historical accumulation zone.
3. ⚠️ Support 3: $0.0590 – Major demand floor and last line of defense.
This would invalidate the current bullish structure and signal a potential mid-term trend reversal.
📐 Pattern Highlight: Symmetrical Triangle
Nature: Neutral continuation/reversal pattern, depending on breakout direction.
Volume Behavior: Typically contracts as price nears the apex, then expands post-breakout.
Strategy: Smart entries usually occur on breakout + retest with volume confirmation.
🧠 Final Thoughts
AIXBT/USDT is reaching a critical inflection point. The symmetrical triangle formation is nearing its apex, suggesting that a large move is imminent. Whether the breakout will be bullish or bearish depends on how price behaves at the key boundaries outlined.
📢 Pro Tip: Watch for breakout direction, volume spikes, and possible retests to position accordingly. Don’t forget to set stop-losses in either scenario to manage risk effectively.
#AIXBT #CryptoBreakout #SymmetricalTriangle #TechnicalAnalysis #AltcoinSetup #ChartPatterns #VolumeAnalysis #SupportAndResistance #CryptoTrading #CryptoTA
✅ Get Free Signals! Join Our Telegram Channel Here: t.me/TheCryptoNuclear
✅ Twitter: twitter.com/crypto_nuclear
✅ Join Bybit : partner.bybit.com/b/nuclearvip
✅ Benefits : Lifetime Trading Fee Discount -50%
✅ Twitter: twitter.com/crypto_nuclear
✅ Join Bybit : partner.bybit.com/b/nuclearvip
✅ Benefits : Lifetime Trading Fee Discount -50%
Disclaimer
The information and publications are not meant to be, and do not constitute, financial, investment, trading, or other types of advice or recommendations supplied or endorsed by TradingView. Read more in the Terms of Use.