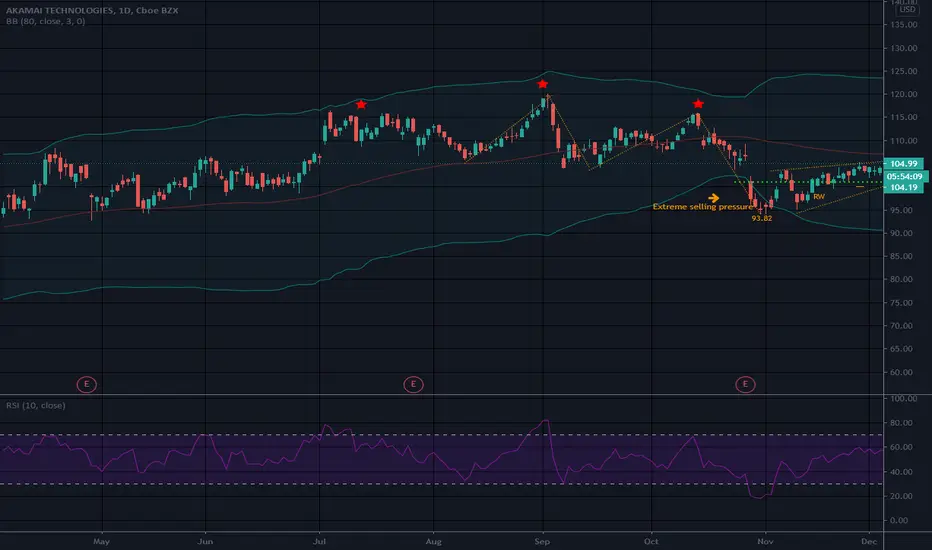
I set the bollinger bands on a 3 standard deviation with a 80 SMA ..if price falls out of this then as a rule, selling pressure is very strong.
Unfortunately AKAM got off the bottom and ended up in a small rising narrowing wedge..if and when it breaks bottom trendline of that RW, I will go long.
Possible Head and shoulders top..
Supply and demand are what makes the market go round (o: A Chart is a mere Xray of supply and demand . Possible head and shoulders top.
Large players are buying this as noted on effective volume . It does not mean it will not go lower. They are investing other folk's money and not their own as a rule...not always but a lot of the time. They are willing to buy at a higher level than most of us are. As long as price goes up in the next eon, they are happy (o:
I have found just because there is accumulation, it is not always at the best price.
The 5 sma has not crossed up and through the 20 sma . Infact it is almost opposite so perhaps not time yet to buy. Some folks buy when the 5 crosses up and through the 20 and sell when the 5 crosses down through the 20. We all have the moving averages that crank our tractor (o:
Price just crossed the 50 sma today..the 50 crossed down through the 100 ma a few weeks ago and both of those moving averages are tilting down. They are both still over a 200 day moving average that is still tilting up, despite it all. The 200 is the longest I use.
Note
Also a possible bear flag. This may pull back a bit. Just watching for nowDisclaimer
The information and publications are not meant to be, and do not constitute, financial, investment, trading, or other types of advice or recommendations supplied or endorsed by TradingView. Read more in the Terms of Use.
Disclaimer
The information and publications are not meant to be, and do not constitute, financial, investment, trading, or other types of advice or recommendations supplied or endorsed by TradingView. Read more in the Terms of Use.