Long
AKTS Forming 4+ #Rectangle #ChartPattern
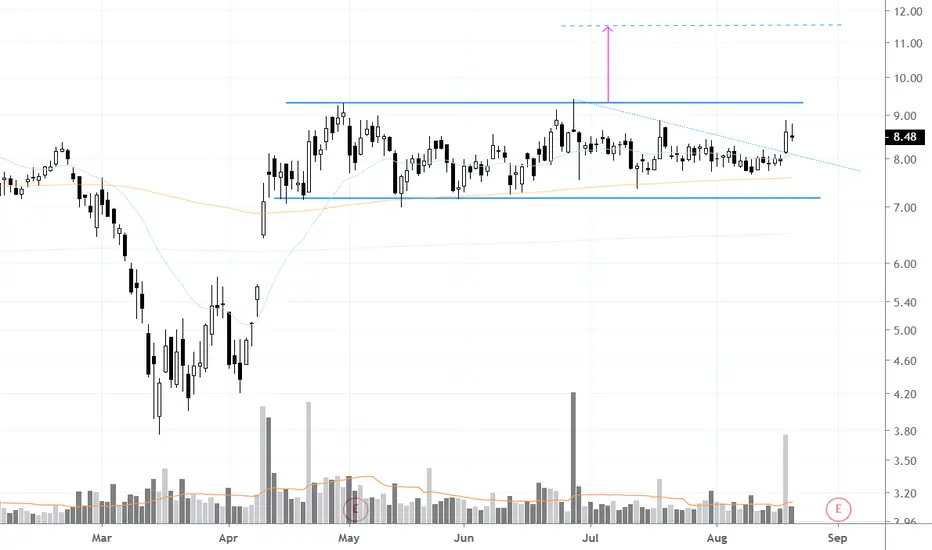
AKTS been trading sideways for over 4 months forming a #rectangle chart pattern with $9.40 acting as a strong resistance.
A breakout and close above that level could set the stage for a strong rally to chart pattern price target identified on the chart.
A breakout and close above that level could set the stage for a strong rally to chart pattern price target identified on the chart.
✔ Momentum & Breakout Trader Since 2006 | Influenced by Mark Minervini VCP Trading Style & William O'Neil CANSLIM 📈
✔ Follow me on Twitter @taplot - twitter.com/TaPlot
✔ YouTube channel youtube.com/@taplot
✔ Follow me on Twitter @taplot - twitter.com/TaPlot
✔ YouTube channel youtube.com/@taplot
Disclaimer
The information and publications are not meant to be, and do not constitute, financial, investment, trading, or other types of advice or recommendations supplied or endorsed by TradingView. Read more in the Terms of Use.