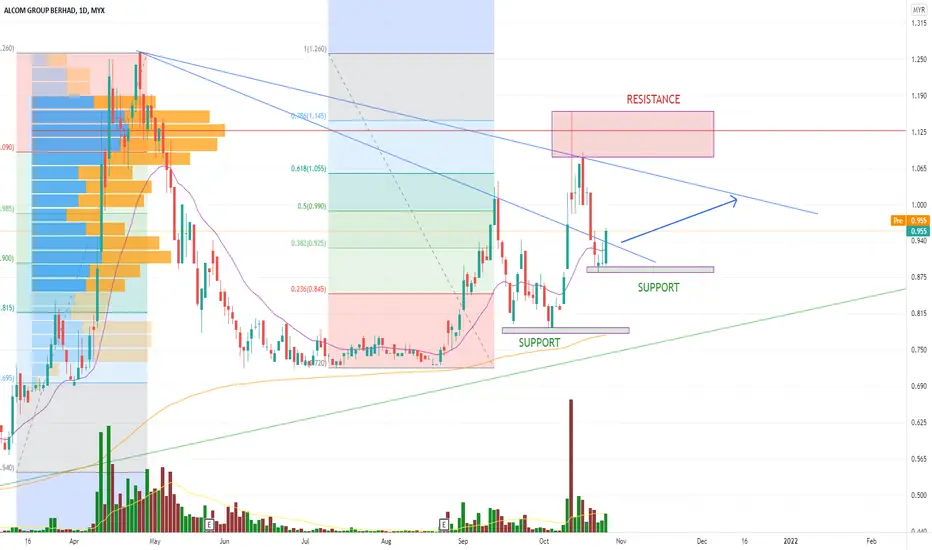
Technical analysis for ALCOM Stock based on Trend Analysis, Chart Pattern and Fibonacci Retracement
Note
Current price candle has break the immediate support line. Price candle 8 Nov 21 show Demand Test Candle with low volume-positive result. Price may move lower to next support line at 0.790.Trade closed: stop reached
This stock lost momentum, don' take position in this stockAHI
Disclaimer
The information and publications are not meant to be, and do not constitute, financial, investment, trading, or other types of advice or recommendations supplied or endorsed by TradingView. Read more in the Terms of Use.
AHI
Disclaimer
The information and publications are not meant to be, and do not constitute, financial, investment, trading, or other types of advice or recommendations supplied or endorsed by TradingView. Read more in the Terms of Use.