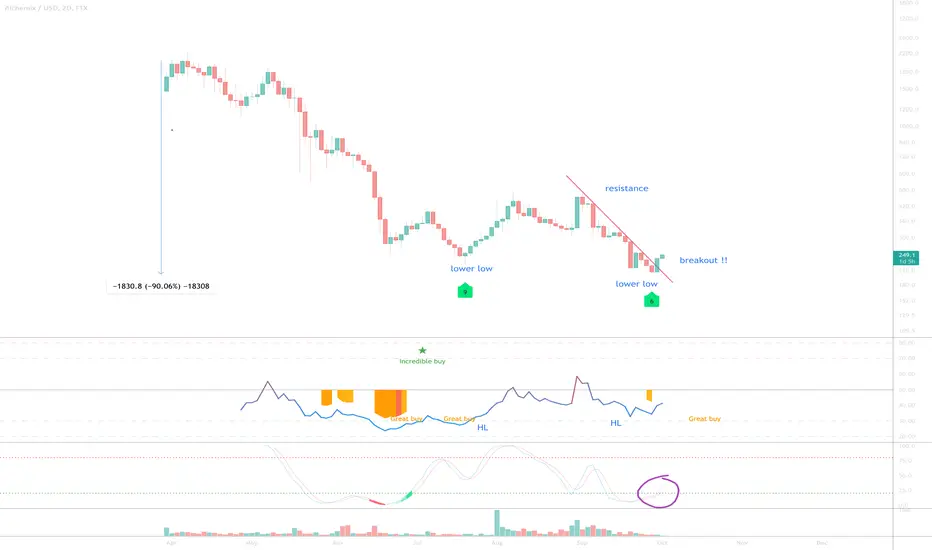
On the above 2-day chart price action has collapsed a massive 90% since mid-April. Since then a ‘incredible buy’ and ‘great buy’ signals have appeared. Numerous reasons now exist to be bullish, including:
1) Price action resistance breakout.
2) Regular bullish divergence. Lower lows have been printing with higher lows in RSI. Six oscillators are now showing bullish divergence with price action. Excellent.
3) Stochastic RSI (purple circle) has just crossed up 20. Fabulous.
4) On the weekly chart below a ‘Dragonfly DOJI candle’ is printing. Although ideally for confirmation another week is required.
5) On the 1-day ALCX / BTC chart shows the same bullish divergence (bottom chart).
Is it possible price action falls further? Sure.
Is it probable? Very unlikely.
1st target: $1350
WW
Weekly chart:

1-day ALCX / BTC chart

1) Price action resistance breakout.
2) Regular bullish divergence. Lower lows have been printing with higher lows in RSI. Six oscillators are now showing bullish divergence with price action. Excellent.
3) Stochastic RSI (purple circle) has just crossed up 20. Fabulous.
4) On the weekly chart below a ‘Dragonfly DOJI candle’ is printing. Although ideally for confirmation another week is required.
5) On the 1-day ALCX / BTC chart shows the same bullish divergence (bottom chart).
Is it possible price action falls further? Sure.
Is it probable? Very unlikely.
1st target: $1350
WW
Weekly chart:
1-day ALCX / BTC chart
Trade active
Trade active
30% so far. Stay long.Note
Now almost 90%. Expect some resistance around the $540 area.Note
Price action confirms support on past resistance. Next leg up should move to $715.Trade active
Price action on the 1-day chart prints a ‘incredible buy’ signal. Same is true on the BTC pair. On the 2-day chart MACD crossover to bullish is printing - look left.Good luck!
Daily chart
2-day yellow box MACD crossover
Note
Up 30% since the buy signal above, awesome huh? And in this environment. Expect a pull back to 220-230 area, no need to FOMO.Trade active
Now that support has claimed past resistance once more projections for a price target can be made.A conservative target would be a re-test of the upper trend line at $1000 to $1350 by early April. You can project a far higher target with an equal amount of confluence, however it would be wise to wait for the upper trend like to be confirmed support or resistance.
Ask me below for updates, I’m not trading this.
Note
This is the monthly ALCX / BTC chart - Look at the length of the tail for December, huge amounts of buying pressure. Price action should catapult with this pressure on the monthly.Note
Over 100% in the past few days, fantastic. Don't chase, might expect resistance approaching $400. A conditional 'great sell' (green bars below) is printing and price action is mostly outside the Bollinger Band on the lower time frames, which is indicative of a reversal to the mean in the near future.Trade active
Look at the confluence around this trend line having corrected from over $400. An easy long entry for me.Don't look a gift horse in the mouth folks.
Note
10 oscillators, yes 10, just printed bullish divergence with the lower lows in price action on the 3-day chart. Previously it was 6 and 7 oscillators resulting in 140% & 190% upside moves, respectively, in the weeks that followed.Note
Nice bounce off trend line with 'incredible buy' signal printing. Let us see where this goes.Trade active
Down 80% almost since January, excellent moment to add to long positions:3-day dollar prints 'incredible buy'
Bullish divergence on the 1-day BTC pair with multiple oscillators:
BTC
bc1q2eckdzh0q8vsd7swcc8et6ze7s99khhxyl7zwy
Weblink: patreon.com/withoutworries
Allow 3-6 months on ideas. Not investment advice. DYOR
bc1q2eckdzh0q8vsd7swcc8et6ze7s99khhxyl7zwy
Weblink: patreon.com/withoutworries
Allow 3-6 months on ideas. Not investment advice. DYOR
Disclaimer
The information and publications are not meant to be, and do not constitute, financial, investment, trading, or other types of advice or recommendations supplied or endorsed by TradingView. Read more in the Terms of Use.