Chart Observations:
Sideways Accumulation Zone (Range-Bound):
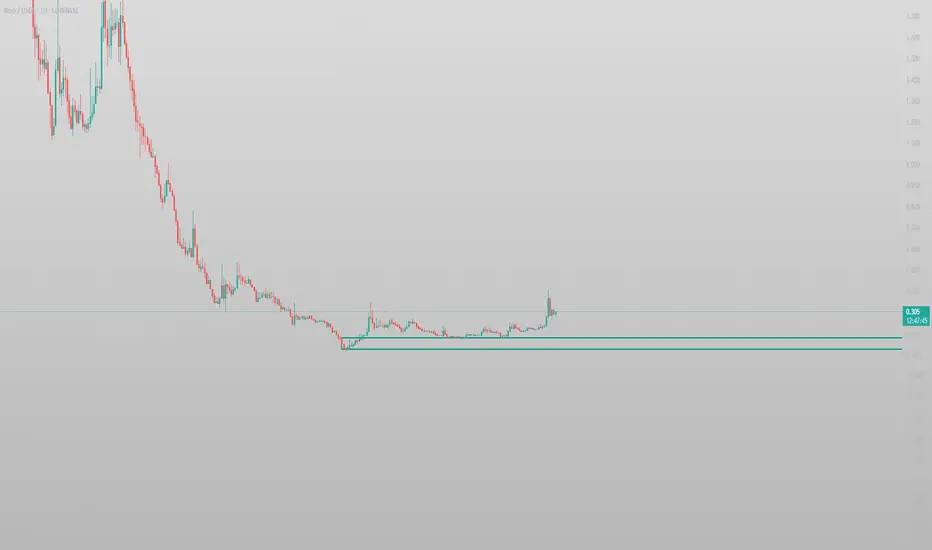
A long period of low volatility and sideways movement near the bottom.
This looks like a classic accumulation zone, where price consolidates before a breakout.
Support Zone:
The green horizontal line below the price action marks a strong support level that held for a long time.
This zone was tested multiple times without being broken, suggesting demand is present here.
Breakout Candle:
A strong bullish candle recently broke out of the accumulation zone with high momentum.
Likely caused by a news event, volume spike, or large buyer entry.
Pullback After Breakout:
After the breakout, the price pulled back a bit but seems to be respecting the breakout level as support.
If it holds, it may act as a new higher low and continuation to the upside may follow.
Sideways Accumulation Zone (Range-Bound):
A long period of low volatility and sideways movement near the bottom.
This looks like a classic accumulation zone, where price consolidates before a breakout.
Support Zone:
The green horizontal line below the price action marks a strong support level that held for a long time.
This zone was tested multiple times without being broken, suggesting demand is present here.
Breakout Candle:
A strong bullish candle recently broke out of the accumulation zone with high momentum.
Likely caused by a news event, volume spike, or large buyer entry.
Pullback After Breakout:
After the breakout, the price pulled back a bit but seems to be respecting the breakout level as support.
If it holds, it may act as a new higher low and continuation to the upside may follow.
Disclaimer
The information and publications are not meant to be, and do not constitute, financial, investment, trading, or other types of advice or recommendations supplied or endorsed by TradingView. Read more in the Terms of Use.
Disclaimer
The information and publications are not meant to be, and do not constitute, financial, investment, trading, or other types of advice or recommendations supplied or endorsed by TradingView. Read more in the Terms of Use.