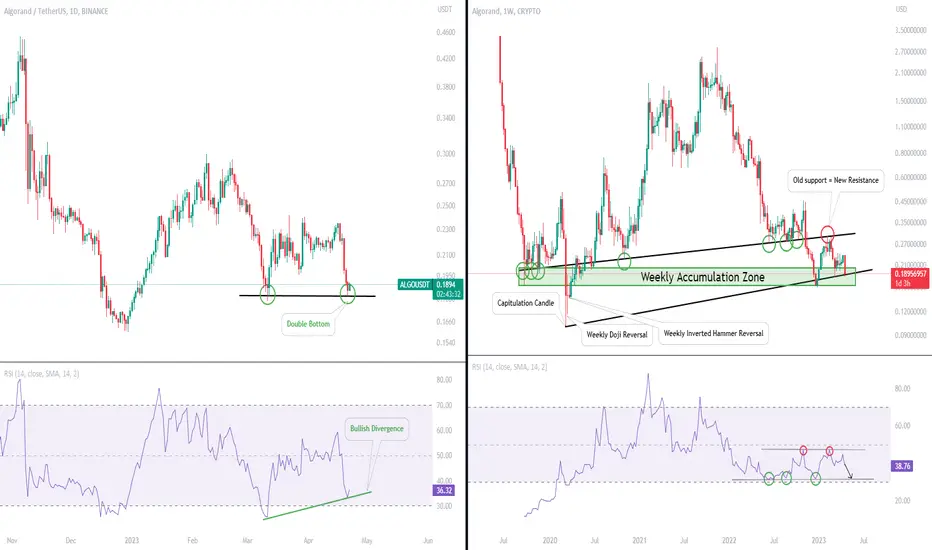
On the left we have the 1D chart and on the right we have the weekly chart.
The daily chart does look bullish and we should expect a reversal in the short term (in confluence with our btc analysis). We created a double bottom in price (around $0.18) as well as a higher low on our daily RSI (creating a bullish divergence).
The weekly chart does look a little more grim, but if you are a long term ALGO holder than you will be happy buying here. On the weekly we have two important trendlines. The higher trendline has many touchpoints of support that has recently been flipped into new resistance (red/green circles). The lower trendline is drawn from our 2020 bottom to where we are today. So far we have managed to not close a weekly candle below this trendline which is a good sign. Price is also inside our green box. Our green box represents our weekly demand zone or where the majority of accumulation happened dating back from 2019 to current day. Therefore, if you buy in this zone you will be very happy in the next bullrun.
But I will say the chart looks like we have not had a capitulation bottom yet. If you look back in 2019 we had a single weekly candle take price from $0.30 all the way down to $0.10. Then we had a weekly doji form followed by an inverse hammer candle which are both major candles that signal the downtrend has come to an end and price is looking to reverse. So far we have seen no weekly candles give us an indication that price is ready to reverse. This is in confluence with Gary Gensler recently attacking ALGO and could somehow lead to a final capitulation in ALGO before the bear market low. If you look at the RSI we are in a clear weekly channel and we are looking for the RSI back at the lower dotted line, or a breakout of our higher dotted line to start the bull run.
Disclaimer
The information and publications are not meant to be, and do not constitute, financial, investment, trading, or other types of advice or recommendations supplied or endorsed by TradingView. Read more in the Terms of Use.
Disclaimer
The information and publications are not meant to be, and do not constitute, financial, investment, trading, or other types of advice or recommendations supplied or endorsed by TradingView. Read more in the Terms of Use.