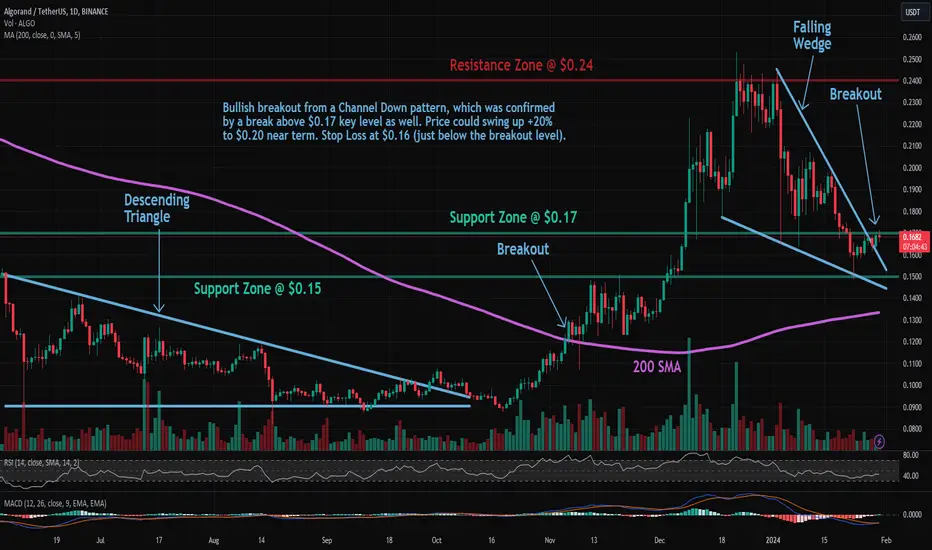
Trade setup: Bullish breakout from a Channel Down pattern, which was confirmed by a break above $0.17 key level as well. Price could swing up +20% to $0.20 near term. Stop Loss at $0.16 (just below the breakout level).
Patterns: Falling Wedge Usually results in a bullish breakout. When price breaks the upper trend line the price is expected to trend higher. Most traders should wait for a completed pattern with a breakout and then place a BUY order.
Trend: Neutral on Short-Term basis, Downtrend on Medium-Term basis and Uptrend on Long-Term basis.
Momentum is Mixed as MACD Line is above MACD Signal Line (Bullish) but RSI < 45 (Bearish).
Support and Resistance: Nearest Support Zone is $0.17, then $0.15. The nearest Resistance Zone is $0.24, then $0.30.
Disclaimer
The information and publications are not meant to be, and do not constitute, financial, investment, trading, or other types of advice or recommendations supplied or endorsed by TradingView. Read more in the Terms of Use.
Disclaimer
The information and publications are not meant to be, and do not constitute, financial, investment, trading, or other types of advice or recommendations supplied or endorsed by TradingView. Read more in the Terms of Use.