In this post I take a look at some of the patterns I trade and how often they show up.
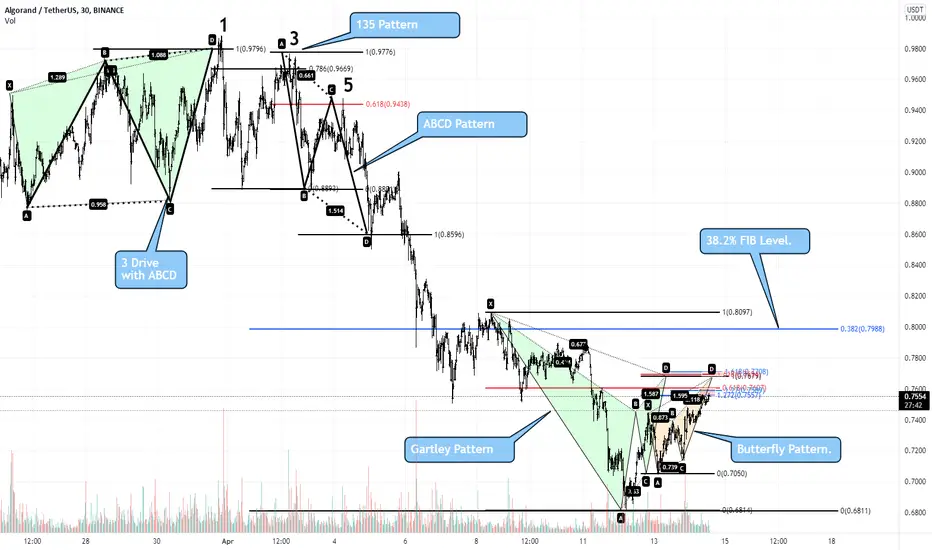
This is a30min chart over the last couple of weeks of ALGORAND.
Firstly is a 3 DRIVE into the high. This pattern often occurs at highs or at lows and normally has an ABCD pattern with it.
Next we have the 135 pattern which occurs when leaving a high or a low.
After that we have the AB=CD Pattern.
Now we are completing a Gartley and Butterfly pattern coming in at mulitiple Fibonacci levels.
This is just a look at the patterns I use and how often they occur.
I hope this helps. Enjoy the day. 👍👍
Note
Note
Worked nicely out of the first group of levels.
Note
More patterns repeating over and over!! 👍👍
t.me/OCEANAISIGNALS
Check out the free Telegram group for Trade setups and Market Updates. Also one on one coaching now available. AI Subscription coming up shortly for an early bird introduction price.
Check out the free Telegram group for Trade setups and Market Updates. Also one on one coaching now available. AI Subscription coming up shortly for an early bird introduction price.
Disclaimer
The information and publications are not meant to be, and do not constitute, financial, investment, trading, or other types of advice or recommendations supplied or endorsed by TradingView. Read more in the Terms of Use.