Pattern Overview
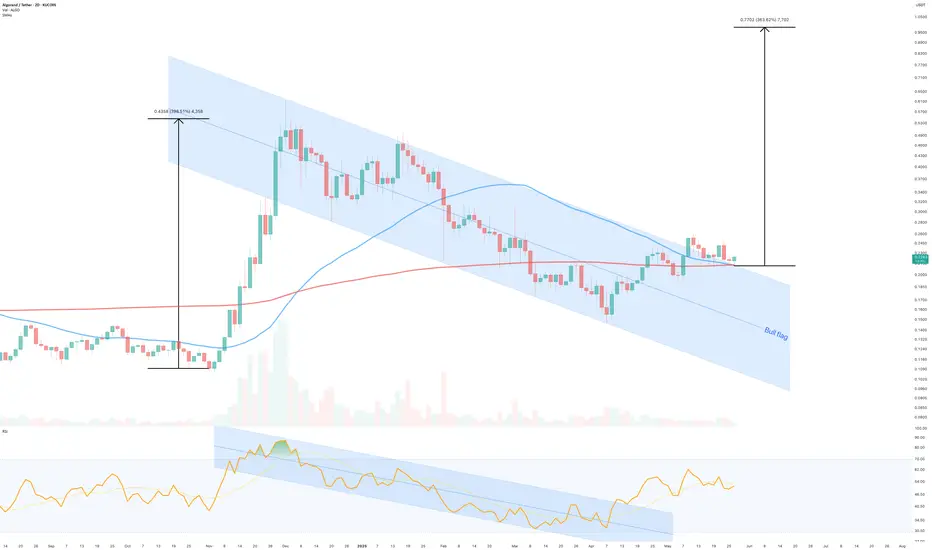
A textbook bull flag formation has materialised and appears to be have confirmed support on past resistance. The pattern shows the classic characteristics of a strong impulse move followed by a controlled consolidation phase.
Key Technical Elements
Flag Formation Structure:
Moving Average Support:
RSI Confirmation:
Technical Outlook
Bull flags are typically measured by adding the height of the flagpole to the breakout point. . The next impulsive wave forecasts price action to $1
Risk Management
While the technical setup appears strong, proper risk management remains essential. A break back into the flag structure, especially below the moving average support zone, would warrant reassessment of the bullish thesis.
Ww
___________________________________________________________________________________
This analysis is for educational purposes and represents technical observations based on price action and indicators shown on the 2-day timeframe.
A textbook bull flag formation has materialised and appears to be have confirmed support on past resistance. The pattern shows the classic characteristics of a strong impulse move followed by a controlled consolidation phase.
Key Technical Elements
Flag Formation Structure:
- Initial strong bullish impulse creating the "flagpole"
- Orderly consolidation within a defined channel (the "flag")
- Decreasing volume during consolidation phase
- Recent breakout above flag resistance with volume confirmation
Moving Average Support:
- Price action has found support at both the 50-day (blue line) and 200-day (red line) moving averages.
- Recent price action bouncing cleanly off these dynamic support levels
RSI Confirmation:
- RSI showing healthy momentum without being overbought
- The oscillator pattern mirrors the flag consolidation, suggesting controlled profit-taking rather than distribution
Technical Outlook
Bull flags are typically measured by adding the height of the flagpole to the breakout point. . The next impulsive wave forecasts price action to $1
Risk Management
While the technical setup appears strong, proper risk management remains essential. A break back into the flag structure, especially below the moving average support zone, would warrant reassessment of the bullish thesis.
Ww
___________________________________________________________________________________
This analysis is for educational purposes and represents technical observations based on price action and indicators shown on the 2-day timeframe.
Trade active
BTC
bc1q2eckdzh0q8vsd7swcc8et6ze7s99khhxyl7zwy
Weblink: patreon.com/withoutworries
Allow 3-6 months on ideas. Not investment advice. DYOR
bc1q2eckdzh0q8vsd7swcc8et6ze7s99khhxyl7zwy
Weblink: patreon.com/withoutworries
Allow 3-6 months on ideas. Not investment advice. DYOR
Disclaimer
The information and publications are not meant to be, and do not constitute, financial, investment, trading, or other types of advice or recommendations supplied or endorsed by TradingView. Read more in the Terms of Use.