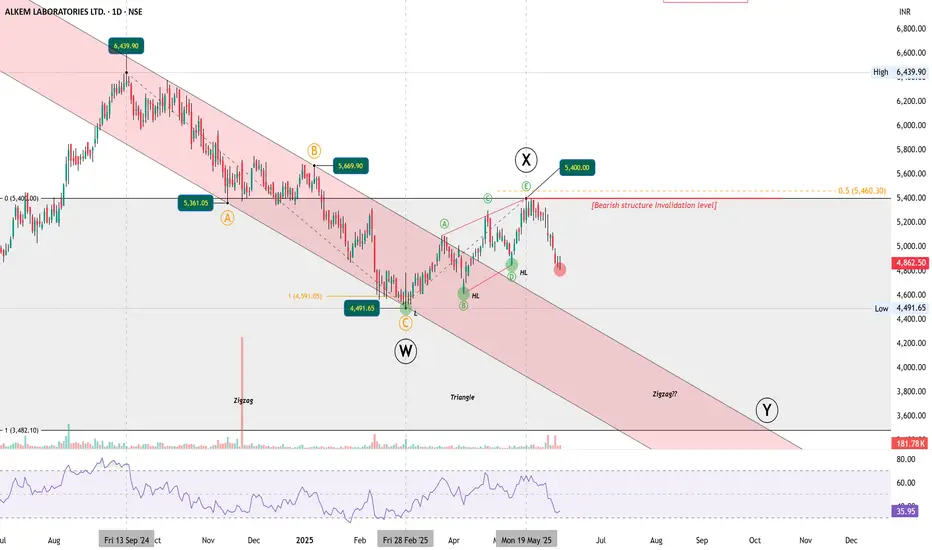
ALKEM continues to respect its larger downward channel, forming what looks like a classic W-X-Y corrective structure.
The RSI breakdown below 40 adds strength to the bearish bias. The projected Wave Y could extend toward the ₹3450 zone if symmetry with Wave W plays out.
Alternate Bullish Scenario:
While bearish remains the primary view, there's a low-probability bullish alternate:
If the move from the February lows to ₹5400 was actually a leading diagonal, then the current fall could be a Wave 2 correction. A sharp reversal from above ₹4491 might trigger a bullish breakout toward new highs.
Chart will be updated as price action evolves.
Disclaimer: This analysis is for educational purposes only and does not constitute investment advice. Please do your own research (DYOR) before making any trading decisions.
- Wave W unfolded as a zigzag.
- Wave X developed as a contracting triangle, ending near ₹5400.
- The current drop appears to be the start of Wave Y, possibly forming another zigzag.
- As long as price stays below ₹5460 (the 0.5 retracement of the entire W-Y structure), the bearish setup remains valid.
The RSI breakdown below 40 adds strength to the bearish bias. The projected Wave Y could extend toward the ₹3450 zone if symmetry with Wave W plays out.
Alternate Bullish Scenario:
While bearish remains the primary view, there's a low-probability bullish alternate:
If the move from the February lows to ₹5400 was actually a leading diagonal, then the current fall could be a Wave 2 correction. A sharp reversal from above ₹4491 might trigger a bullish breakout toward new highs.
Chart will be updated as price action evolves.
Disclaimer: This analysis is for educational purposes only and does not constitute investment advice. Please do your own research (DYOR) before making any trading decisions.
WaveXplorer | Elliott Wave insights
📊 X profile: @veerappa89
📊 X profile: @veerappa89
Disclaimer
The information and publications are not meant to be, and do not constitute, financial, investment, trading, or other types of advice or recommendations supplied or endorsed by TradingView. Read more in the Terms of Use.