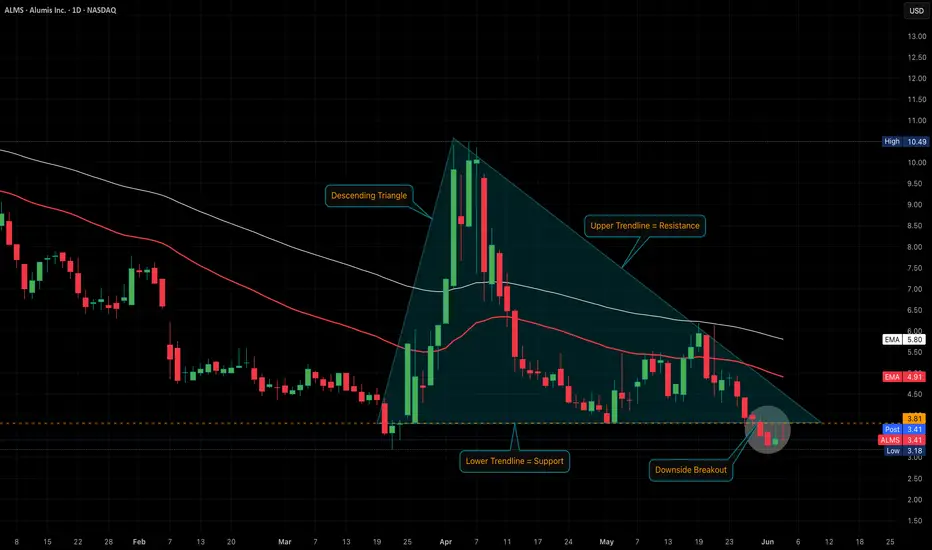
The stock's been in a steady downtrend since late 2024, and more recently formed a textbook descending triangle: sloping upper trendline (resistance), flat lower trendline (support). That support level gave way on May 30th with a decisive break lower.
We saw a brief attempt to reclaim that support zone, but so far, the $3.81 area has flipped into resistance. Stock currently sitting at $3.41 -- and in my view, a sustained move back above $3.81 would be the first meaningful signal of potential reversal. Until then, the technicals remain heavy, and breakdown momentum remains intact.
I see potential here longer-term (was previously involved with SLRN prior to the ALMS merger), but not chasing here. Sitting patient and waiting for confirmation before stepping in. Stay tuned. GLTA.
Disclaimer
The information and publications are not meant to be, and do not constitute, financial, investment, trading, or other types of advice or recommendations supplied or endorsed by TradingView. Read more in the Terms of Use.
Disclaimer
The information and publications are not meant to be, and do not constitute, financial, investment, trading, or other types of advice or recommendations supplied or endorsed by TradingView. Read more in the Terms of Use.