Updated
ALPHAUSDT is testing the resistance
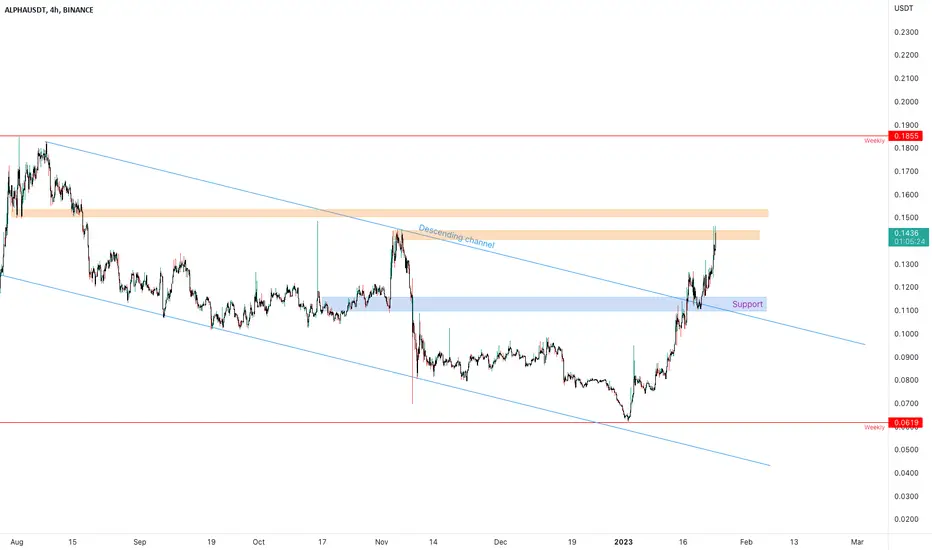
The ALPHA/USDT pair appears to have bounced off of a key weekly support level, breaking out of a descending trend. It has retested the previous resistance as support and is currently testing a 4-hour resistance level. The next weekly resistance level could be the next target for price action. Overall, the technical analysis suggests a bullish outlook for the pair in the short-term.
A descending channel is a bearish technical chart pattern that is formed by two downward-sloping trendlines that connect a series of lower highs and lower lows. The pattern is formed when the price action of an asset is moving in a downward direction within the boundaries of these two trendlines. The upper trendline represents the resistance level, while the lower trendline represents the support level. A descending channel is considered a bearish pattern as it indicates that the asset is experiencing a downtrend and that the selling pressure is stronger than the buying pressure. Traders typically look for a break above the upper trendline, or a break below the lower trendline, as a sign of a potential trend reversal.
How to approach it?
We are waiting for a clear breakout of the 4h resistance, According to Plancton's strategy, we can set a nice order
–––––
Keep in mind.
–––––
Follow the Shrimp 🦐
A descending channel is a bearish technical chart pattern that is formed by two downward-sloping trendlines that connect a series of lower highs and lower lows. The pattern is formed when the price action of an asset is moving in a downward direction within the boundaries of these two trendlines. The upper trendline represents the resistance level, while the lower trendline represents the support level. A descending channel is considered a bearish pattern as it indicates that the asset is experiencing a downtrend and that the selling pressure is stronger than the buying pressure. Traders typically look for a break above the upper trendline, or a break below the lower trendline, as a sign of a potential trend reversal.
How to approach it?
We are waiting for a clear breakout of the 4h resistance, According to Plancton's strategy, we can set a nice order
–––––
Keep in mind.
- 🟣 Purple structure -> Monthly structure.
- 🔴 Red structure -> Weekly structure.
- 🔵 Blue structure -> Daily structure.
- 🟡 Yellow structure -> 4h structure.
- ⚫️ black structure -> <= 1h structure.
–––––
Follow the Shrimp 🦐
Note
22%Disclaimer
The information and publications are not meant to be, and do not constitute, financial, investment, trading, or other types of advice or recommendations supplied or endorsed by TradingView. Read more in the Terms of Use.
Disclaimer
The information and publications are not meant to be, and do not constitute, financial, investment, trading, or other types of advice or recommendations supplied or endorsed by TradingView. Read more in the Terms of Use.