🟢
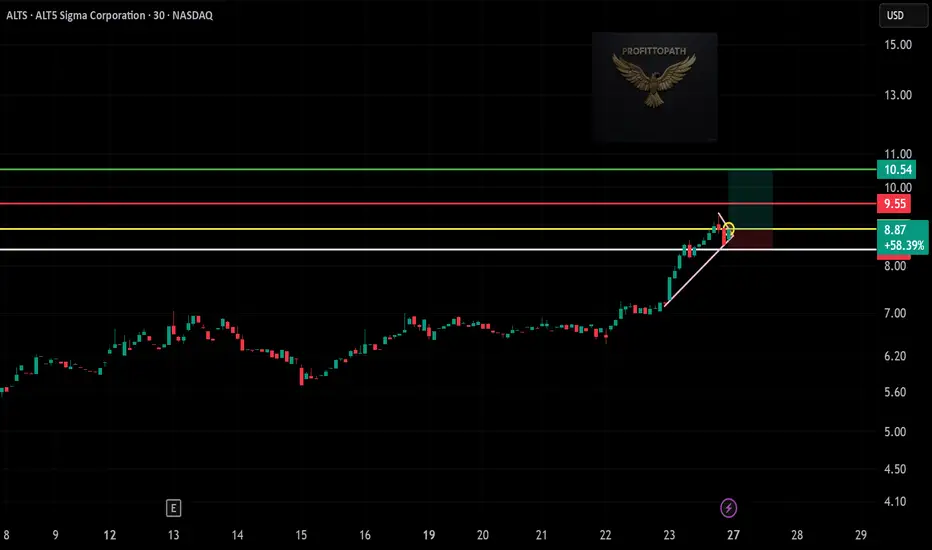
Ticker: ALTS
Timeframe: 30-min chart
Current Price: $8.91
% Change: +24.09%
🔍 Technical Highlights
Strong bullish momentum with a clear breakout above consolidation.
A clean uptrend with higher lows and strong candles.
Breakout zone marked with a yellow circle – price is retesting the breakout level.
🎯 Trade Plan
Entry Zone: Around $8.87 (current area of breakout retest)
Stop-Loss (SL): ~$8.25 (below support zone – yellow line)
Target 1 (TP1): $9.55 (resistance level – red line)
Target 2 (TP2): $10.54 (major resistance zone – green line)
✅ Trade Bias
Bullish above $8.25
Neutral between $8.25 and $8.00
Bearish below $8.00
Disclaimer
The information and publications are not meant to be, and do not constitute, financial, investment, trading, or other types of advice or recommendations supplied or endorsed by TradingView. Read more in the Terms of Use.
Disclaimer
The information and publications are not meant to be, and do not constitute, financial, investment, trading, or other types of advice or recommendations supplied or endorsed by TradingView. Read more in the Terms of Use.