Long
Ambrosus (AMB) / USD - Regular bullish divergence
A lot is going on in this chart. Recently the chart came to my attention by another tradingview idea from a couple of months ago so I decided to spend some hours studying. In summary, it seems to me to be one of the most bullish charts for an asset listed on the Binance exchange. Every week I study all assets listed on Binance for opportunities. Today 3 came up. This is 1/3.
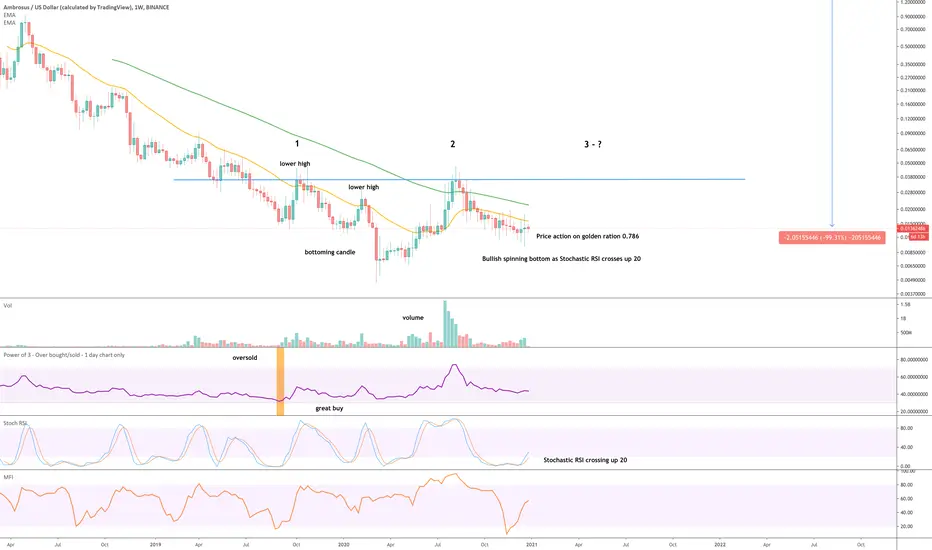
The small market capital is the risky part, < $6 million dollars. However the good side is the circulating supply is more than 86% of the total supply, that’s a lot better than can be said for other alt-coins.
The technical:
This token has corrected over 99% from $2. Was oversold in September of last year (orange column) creating lower highs + bottoming candle. Since then price action has been consolidating.
On the above weekly chart we have:
1) A bottoming candle created on March 2020 followed by a considerable amount of volume given the market cap.
2) Price action was rejected from resistance for the 2nd time (labelled ‘2’).
3) Price action has retraced to the golden ratio, 0.786
4) The last weekly candle printed confirmed a bullish spinning top reversal pattern.
5) Stochastic RSI crosses up 20.
6) Price action on the 3-day chart (not shown here) is in regular bullish divergence with the oscillators.
Good luck!
1st target is 40 cents or 30x from here.
Trade active
Trade active
Trade active
It might not look it but price action is up 50% in a little under a month. Not bad.Note
Almost up 300% with a breakout of past resistance.Trade active
Making good progress - next target 12 centsNote
Beautiful structure - past resistance becomes support.Trade active
The 10-day chart prints a new candle following the 600% rise so far and it's bullish.Stay long!
Trade active
10x so far. Convinced a 100x / $1 will come if you're patient.Note
Making an effort to go through open crypto ideas today during this correction - I'm sure there's a lot of panic.Healthy correction to the 21-week EMA (yellow line). Look left - circled in orange are previous support and resistance test points. This is what this week is all about. Nothing to do.
Trade active
A little bit of history repeating.Trade active
The 10-day BTC pair looks rather fantastic Trade active
Alt-season is hereBTC
bc1q2eckdzh0q8vsd7swcc8et6ze7s99khhxyl7zwy
Weblink: patreon.com/withoutworries
Allow 3-6 months on ideas. Not investment advice. DYOR
bc1q2eckdzh0q8vsd7swcc8et6ze7s99khhxyl7zwy
Weblink: patreon.com/withoutworries
Allow 3-6 months on ideas. Not investment advice. DYOR
Disclaimer
The information and publications are not meant to be, and do not constitute, financial, investment, trading, or other types of advice or recommendations supplied or endorsed by TradingView. Read more in the Terms of Use.
BTC
bc1q2eckdzh0q8vsd7swcc8et6ze7s99khhxyl7zwy
Weblink: patreon.com/withoutworries
Allow 3-6 months on ideas. Not investment advice. DYOR
bc1q2eckdzh0q8vsd7swcc8et6ze7s99khhxyl7zwy
Weblink: patreon.com/withoutworries
Allow 3-6 months on ideas. Not investment advice. DYOR
Disclaimer
The information and publications are not meant to be, and do not constitute, financial, investment, trading, or other types of advice or recommendations supplied or endorsed by TradingView. Read more in the Terms of Use.