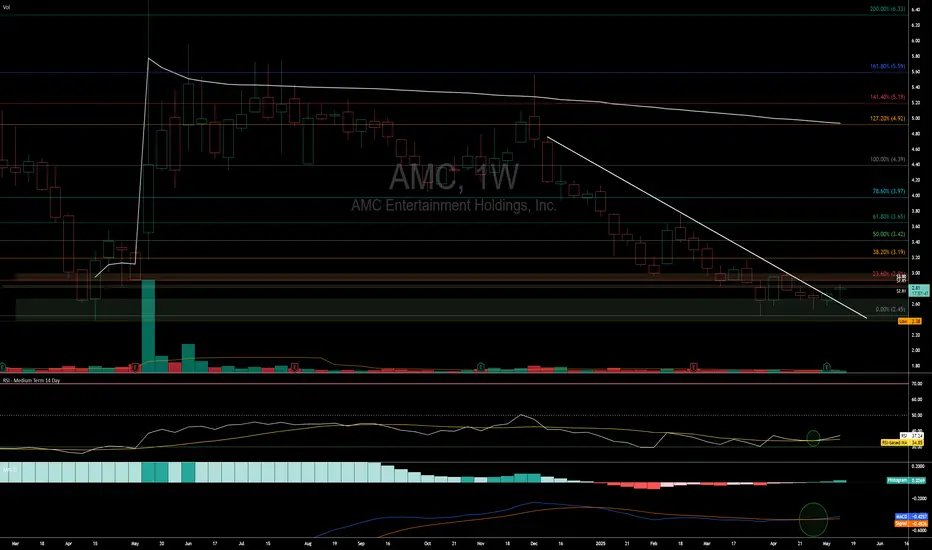
On both the Weekly and Daily we have the MACD in GREEN, RSI crossing MA which the weekly is showing downtrend being broke.
Daily chart Is almost or is right on the 8 day crossing the 21 day EMA. Daily is also breaking the downtrend of ~$4.40 along with breaking the 100 day SMA. Holding VWAP form the low of $2.45 on 4/4/2025.
- Need to see continuation out of the downtrend with volume
- Break the resistance level of $2.81 - $2.85, which has the 100 Day SMA around the $2.83 that needs to be cleared.
- Then $2.90 - $3.00 and we'll follow the Fib Levels and mark support/resistance levels as we go.
This could get spicy so buckle up knuckleheads!
Note
5/22/2025 was a great day with volume pushing the Disclaimer
The information and publications are not meant to be, and do not constitute, financial, investment, trading, or other types of advice or recommendations supplied or endorsed by TradingView. Read more in the Terms of Use.
Disclaimer
The information and publications are not meant to be, and do not constitute, financial, investment, trading, or other types of advice or recommendations supplied or endorsed by TradingView. Read more in the Terms of Use.