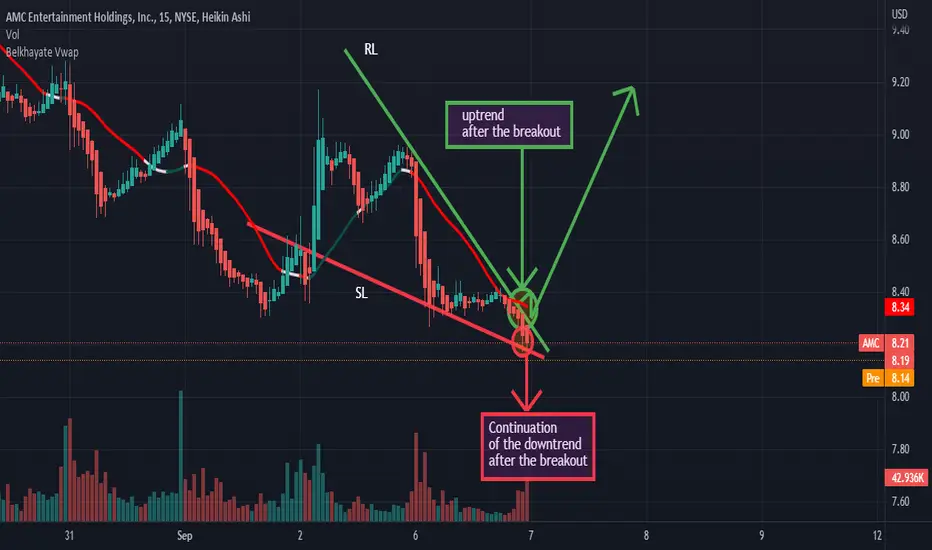
Hello!! As you can see on the graph, the resistance line and the support line converge, that is, they go in the same direction. Looking at the chart pattern, the market may continue to decline if the support line is forcefully broken by a large red candle and followed by large red volume. On the other hand, we could have a high probability that the market goes up. But, this can only happen if the vwap indicator as well as the resistance line are forcefully broken by a large green candle and followed by a large green volume. Thanks...
Disclaimer
The information and publications are not meant to be, and do not constitute, financial, investment, trading, or other types of advice or recommendations supplied or endorsed by TradingView. Read more in the Terms of Use.
Disclaimer
The information and publications are not meant to be, and do not constitute, financial, investment, trading, or other types of advice or recommendations supplied or endorsed by TradingView. Read more in the Terms of Use.