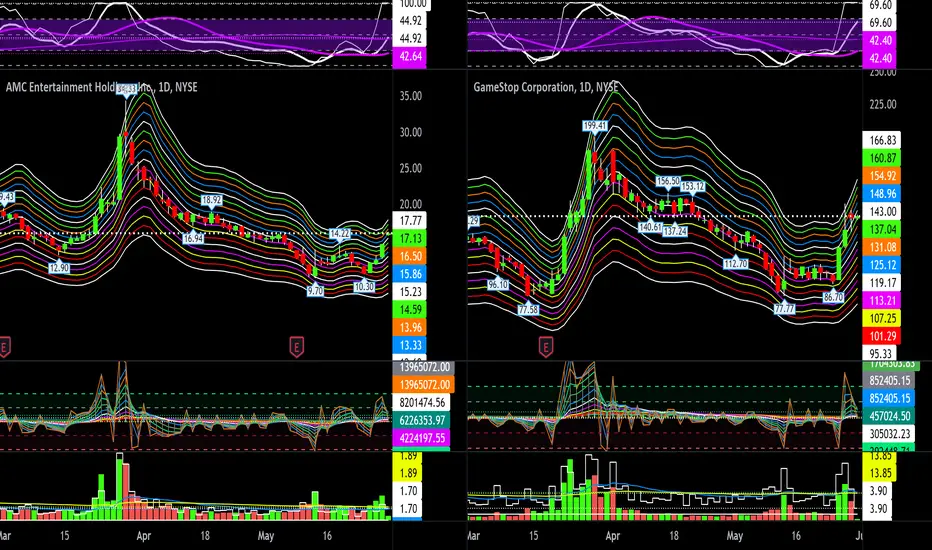
AMC & GME split frame 1 day charts with MTTC2.0 beta, pi RSI, Fibonacci VIP, ATRxxlBeta, Fibonacci MA7, Volume & PivotsHL indicator levels:
Do your own due diligence, your risk is 100% your responsibility. This is for educational and entertainment purposes only. You win some or you learn some. Consider being charitable with some of your profit to help humankind. Good luck and happy trading friends...
*3x lucky 7s of trading*
7pt Trading compass:
Price action, entry/exit
Volume average/direction
Trend, patterns, momentum
Newsworthy current events
Revenue
Earnings
Balance sheet
7 Common mistakes:
+5% portfolio trades, capital risk management
Beware of analyst's motives
Emotions & Opinions
FOMO : bad timing, the market is ruthless, be shrewd
Lack of planning & discipline
Forgetting restraint
Obdurate repetitive errors, no adaptation
7 Important tools:
Trading View app!, Brokerage UI
Accurate indicators & settings
Wide screen monitor/s
Trading log (pencil & graph paper)
Big, organized desk
Reading books, playing chess
Sorted watch-list
Checkout my indicators:
Fibonacci VIP - volume
Fibonacci MA7 - price
pi RSI - trend momentum
TTC - trend channel
AlertiT - notification
tickerTracker - MFI Oscillator
tradingview.com/u/growerik/
Note
AMC intraday volume speaks volumes 🤣Note
GME earnings tomorrow Wednesday 6/1 @ 4:05pmNote
AMC 6/3 expiry options data:Put Volume Total 40,310
Call Volume Total 95,400
Put/Call Volume Ratio 0.42
Put Open Interest Total 90,944
Call Open Interest Total 190,502
Put/Call Open Interest Ratio 0.48
AMC 6/17 expiry options data:
Put Volume Total 18,740
Call Volume Total 23,287
Put/Call Volume Ratio 0.80
Put Open Interest Total 186,734
Call Open Interest Total 263,018
Put/Call Open Interest Ratio 0.71
AMC LEAPS 1/20/2023 expiry options data:
Put Volume Total 2,189
Call Volume Total 2,068
Put/Call Volume Ratio 1.06
Put Open Interest Total 171,108
Call Open Interest Total 212,524
Put/Call Open Interest Ratio 0.81
Note
*options use 100x leverage you could lose everything*There are many types of options trading strategies and positions, simple to sophisticated & hybrids. I group them into theta, delta or mix strategies and bull, bear or neutral positions. There's a buy side and sell side to every trade. If you check the open interest (OI), you can see how liquid it is. Check how wide the bid vs ask spread is.
Theta:
iron condor
iron fly
covered call
cash secured put
calendar spread
collar
Delta:
call
put
straddle
strangle
debit spread
credit spread
Bull:
call
put credit spread
call debit spread
cash secured put
Bear:
put
call credit spread
put debit spread
covered call
Neutral:
straddle
strangle
iron condor
iron fly
collar (often used for downside insurance)
calendar spread (short or long time)
Options important variables:
Strike = share price
itm, atm, otm = strike position
Expiry = Date of expiration
Value = H, L & Mark
Liquidity = bid vs ask spread
Direction = put or call
OI = open interest
V = volume
CP = chance of profit
IV = implied volatility
Delta = price
Theta = time
Vega = volatility
Gamma = momentum
Note
GME 6/3 expiry options data:Put Volume Total 16,104
Call Volume Total 29,255
Put/Call Volume Ratio 0.55
Put Open Interest Total 46,897
Call Open Interest Total 64,188
Put/Call Open Interest Ratio 0.73
GME 6/17 expiry options data:
Put Volume Total 3,109
Call Volume Total 4,505
Put/Call Volume Ratio 0.69
Put Open Interest Total 63,994
Call Open Interest Total 101,171
Put/Call Open Interest Ratio 0.63
GME LEAPS 1/20/2023 expiry options data:
Put Volume Total 1,269
Call Volume Total 482
Put/Call Volume Ratio 2.63
Put Open Interest Total 121,057
Call Open Interest Total 52,754
Put/Call Open Interest Ratio 2.29
Note
GME is up after earnings. InterestingNote
GME green again todayNote
looks like GME making a leg up todayTrade active
Got 100 shares of APE because it should equal 100 shares of AMC once APE options go live. Totally speculative only small position.Trading indicators:
tradingview.com/u/Options360/
tradingview.com/u/Options360/
Disclaimer
The information and publications are not meant to be, and do not constitute, financial, investment, trading, or other types of advice or recommendations supplied or endorsed by TradingView. Read more in the Terms of Use.
Trading indicators:
tradingview.com/u/Options360/
tradingview.com/u/Options360/
Disclaimer
The information and publications are not meant to be, and do not constitute, financial, investment, trading, or other types of advice or recommendations supplied or endorsed by TradingView. Read more in the Terms of Use.