📈 AMD Technical Analysis – Bullish Breakout in Sight?
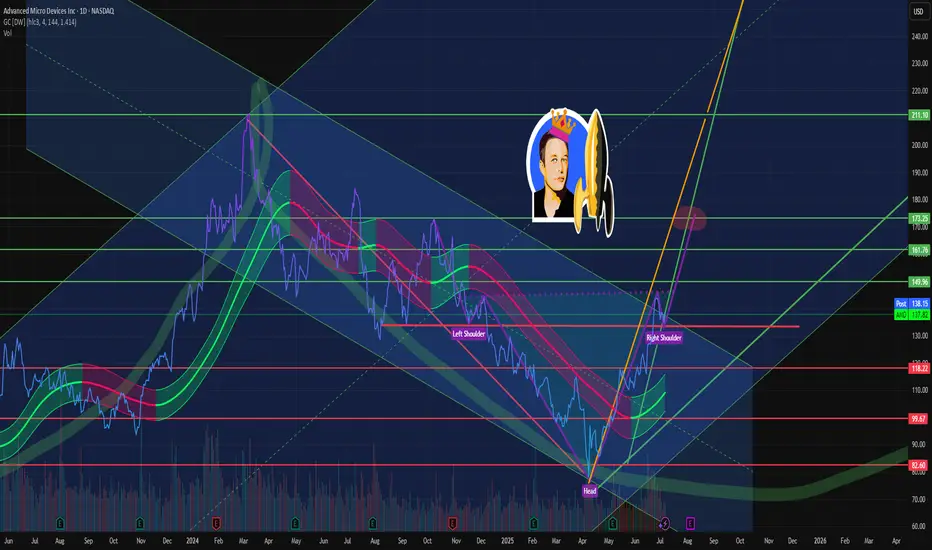
"We are currently testing the parallel channel at $138 for a potentially very bullish confirmation afterward. If confirmed, I would set a target at $170 USD."
🔍 Let’s break it down:
- 🧭 Key Level at $138: AMD is hovering around a critical resistance level within a well-defined parallel channel. This zone is acting as a decision point—either we break out with strength or face a pullback.
- 🧠 Head and Shoulders Pattern: The chart shows a classic inverse head and shoulders formation (Left Shoulder – Head – Right Shoulder), which is typically a bullish reversal signal. If the neckline (around $138) is broken with volume, it could trigger a strong rally.
- 🚀 Bullish Confirmation: A confirmed breakout above $138, especially with strong volume and momentum indicators turning positive, could ignite a powerful uptrend. This would validate the bullish thesis.
- 🎯 Target at $170: If the breakout is confirmed, a price target of $170 is ambitious but realistic. It aligns with the upper bounds of the projected move from the head and shoulders pattern and the channel extension.
- 🛑 Risk Management: As always, keep an eye on false breakouts. A failure to hold above $138 could lead to a retest of lower support levels.
💡 Final Thoughts: AMD is at a technical crossroads. A breakout above $138 could be the spark for a major bullish run toward $170. Keep your eyes on volume, momentum, and confirmation signals. This could be a textbook setup for swing traders and long-term bulls alike. 📊🔥
The information and publications are not meant to be, and do not constitute, financial, investment, trading, or other types of advice or recommendations.
Thank you!
Subcribe TSXGanG! 💡🎯
Disclaimer
The information and publications are not meant to be, and do not constitute, financial, investment, trading, or other types of advice or recommendations supplied or endorsed by TradingView. Read more in the Terms of Use.
Disclaimer
The information and publications are not meant to be, and do not constitute, financial, investment, trading, or other types of advice or recommendations supplied or endorsed by TradingView. Read more in the Terms of Use.