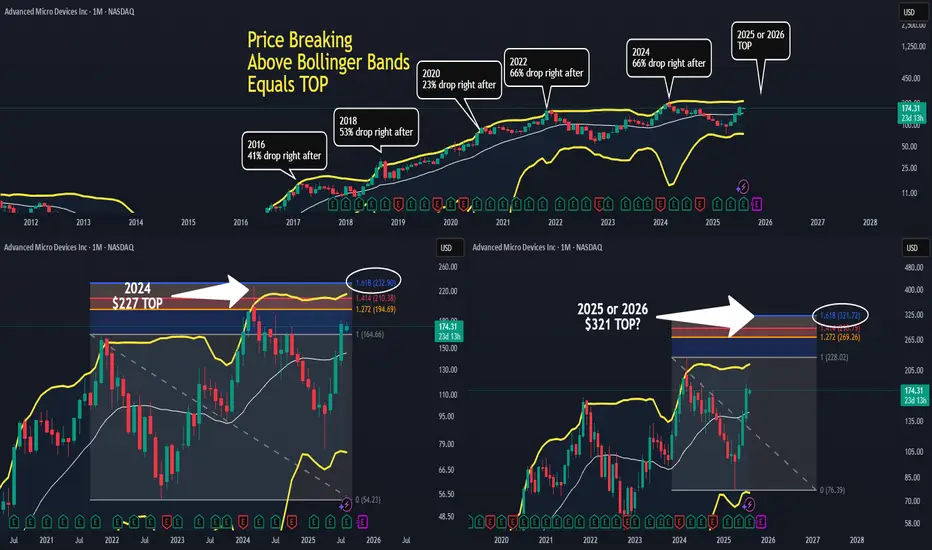
AMD on the Monthly Chart using Bollinger Bands.
The Top Chart is a brief history of AMD's market tops.
Whenever price broke above the Bollinger Band (Yellow Band) that marked the top.
Bottom Left Chart is the 2024 market top.
Price broke above the Bollinger Band and headed towards the 1.618 Fibonacci.
It didn't hit the $232 exactly, but got very close.
Priced topped at $227.
Roughly a $5 difference.
Bottom Right Chart is the current price action.
The market cycle top should hit sometime in 2025 or 2026.
If the chart plays out like the previous pattern, then the 1.618 Fibonacci should be
the near target for the market cycle top.
This target is $321.
Will the market top hit $321 exactly?
I doubt it, but you never know.
But being honest, I did create a limit sell for $309.
We'll see how accurate I am.
I need to see price break above the Bollinger Band, then see how price
reacts to the Fibonacci ratios of 1.272, 1.414 and 1.618.
Fibonacci 1.272 is listed as $269, and Fibonacci 1.414 is at $290.
I could set limit sells at these three Fibonacci levels to better scale out of my positions.
Disclaimer
The information and publications are not meant to be, and do not constitute, financial, investment, trading, or other types of advice or recommendations supplied or endorsed by TradingView. Read more in the Terms of Use.
Disclaimer
The information and publications are not meant to be, and do not constitute, financial, investment, trading, or other types of advice or recommendations supplied or endorsed by TradingView. Read more in the Terms of Use.