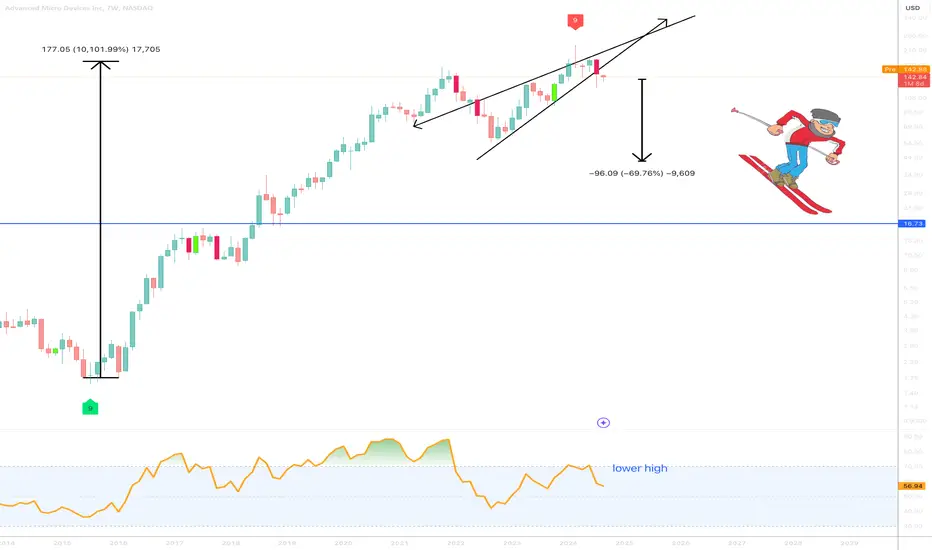
On the above 7 week chart price action has rallied 10,000% since 2016. Cathie Wood is now a buyer. Should we be concerned?
Yahoo finance - August
“Cathie Wood-Led Ark Invest Buys $47.5M Of AMD Shares”
source:tinyurl.com/zc3cah5p
Motley Fool - September
“AMD is more stable financially and boasts a more established role in artificial intelligence than Intel. Alongside recent growth in its data centre division, AMD's stock is too good to pass up.”
source: tinyurl.com/3dvmjnp3
Madness.
Why bearish?
Failed trend support. It is very clear to see, price action has broken through support.
Rising wedge breakout. The trend support breakout confirmed the rising wedge direction. Yes price action could rally all the way to 190 in the next 1 or 2 candles but that would not invalidate the wedge. The rules of a rising wedge allow us to forecast the correction magnitude, 70% to the $40 area.
The best for last.
** Double top bearish divergence with Gravestone DOJI **
Not since 2016 has this many oscillators printed negatively with price action. Both instances measured with the same specifications. This higher high in price action with a lower low in RSI (among others) following a Gravestone DOJI print…. Go Cathie.
A clearer picture of the Gravestone DOJI is shown below.
Is it possible price action continues to rise? Sure.
Is it probable? No.
Ww
7 week Gravestone DOJI
Trade active
The breakout has printed with the wedge on the main chart confirming resistance.A clearer chart below on a lower time frame, 3 week, has the bear flag with $60 forecast.
This is the start of a multi year downtrend towards lower lows.
Note
Not only has the wedge confirmed, so has the bearish divergence on the 3 month chart.In 1985 those circumstance resulted in a 90% correction.
3 month
Note
broken market structure on multiple timeframesNote
25% down, 45% to go... Note
46% down, only 25% to go... Note
**Relief rally expected **
Price action is considerably oversold on the daily through 3 day charts, a rally to circa 120 should be expected. However consider this as an exit opportunity if you missed the 1st opportunity to exit at 140 when the idea was published.
** Weekly death cross Late August 2025 **
The weekly chart indicates a death cross approaches. The forecast uses the Box Jenkins methodology, which is well suited to the timeframe currently studied. Previous death crosses saw dramatic corrections in price action. The last 5 weekly crosses are shown below.
Will this time be different?
i’m sure the bulls will say so.
Ww
August circa 25th, 2025 - Death cross
70% correction from July 2012
90% correction from May 2007
80% correction from April 2002
2 x 50% corrections from May 1996 and May 1998
BTC
bc1q2eckdzh0q8vsd7swcc8et6ze7s99khhxyl7zwy
Weblink: patreon.com/withoutworries
Allow 3-6 months on ideas. Not investment advice. DYOR
bc1q2eckdzh0q8vsd7swcc8et6ze7s99khhxyl7zwy
Weblink: patreon.com/withoutworries
Allow 3-6 months on ideas. Not investment advice. DYOR
Disclaimer
The information and publications are not meant to be, and do not constitute, financial, investment, trading, or other types of advice or recommendations supplied or endorsed by TradingView. Read more in the Terms of Use.