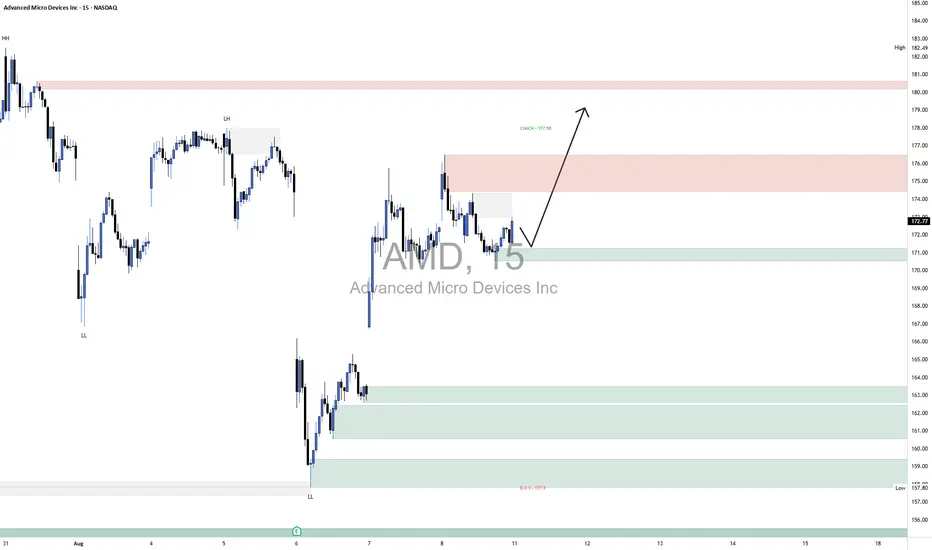
On the AMD 15-minute chart, the broader market structure has shifted from a recent downtrend, marked by a Lower High (LH) and Lower Low (LL) sequence, into a potential reversal phase. This transition was confirmed by a Change of Character (CHoCH) at 177.98, breaking above the prior LH. That move signals that sellers have lost some control, and buyers may now be positioning for a continuation upward if they can defend nearby support.
The nearest demand zone lies between 171.00–172.00, where buyers previously stepped in with strength, creating a sharp bounce. This makes it a strong short-term support area. Above, supply is positioned at 174.50–176.00, where price previously stalled and dropped, indicating active sellers. A more significant supply cap remains at 179.00–181.00, which caused a major rejection earlier in the month and stands as a strong resistance zone.
Within the marked region, price is hovering just above the 171s demand after failing to push through the mid-supply area. The current price action suggests a likely shallow pullback into the 171.50–172.00 demand to absorb liquidity before attempting another push toward the 176.00–178.00 range.
Trade bias: Bullish
Expected direction: Higher after a pullback into demand
Invalidation level: A close below 171.00 would weaken the bullish case and open the door for a deeper drop toward 168.00
Momentum condition: Slightly favors buyers, with higher lows forming despite supply pressure
Candle behavior: Short-bodied consolidation candles above demand, indicating absorption rather than aggressive selling
Looking for powerful AI trading signals? Visit ProSignal.ai and take your trading to the next level! or join our telegram channel at t.me/prosignalai
Disclaimer
The information and publications are not meant to be, and do not constitute, financial, investment, trading, or other types of advice or recommendations supplied or endorsed by TradingView. Read more in the Terms of Use.
