Since bottoming out on April 10, 2025, Advanced Micro Devices (AMD) has embarked on a robust rally, signaling a bullish trend. Technical analysis reveals a five-swing sequence from the April 10 low, favoring continued upward momentum. The initial ascent, wave (1), peaked at $97.91, followed by a corrective pullback in wave (2) that found support at $83.75. The stock then surged in wave (3) to $122.52. A subsequent retracement in wave (4) concluded at $107.10, as depicted in the one-hour chart below. Currently, wave (5) is unfolding, structured as an impulse in a lesser degree, driving the stock higher.
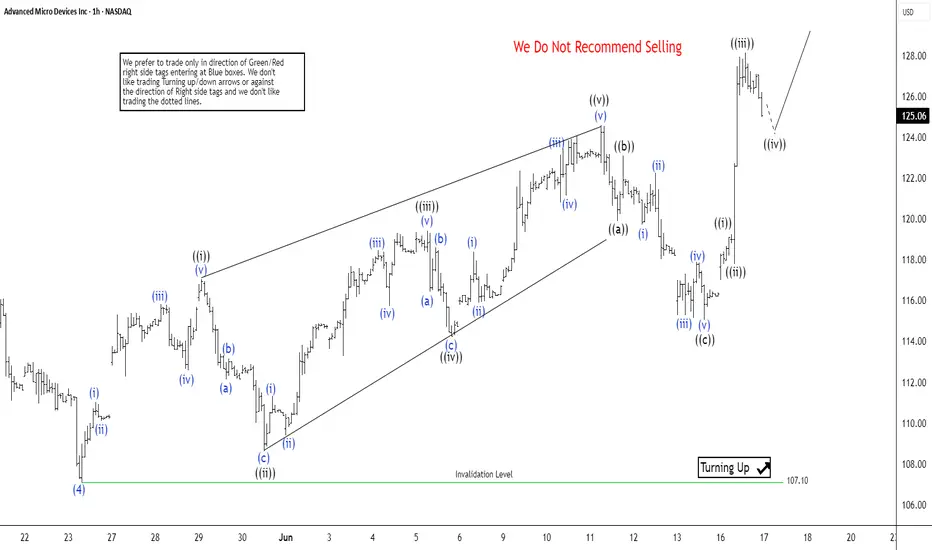
From the wave (4) low, the subdivision of wave (5) began with wave ((i)) reaching $117.05, followed by a dip in wave ((ii)) to $108.62. The rally resumed in wave ((iii)), peaking at $119.40, with wave ((iv)) retracing to $114.25. The final leg, wave ((v)), concluded at $124.60, completing wave 1 of a higher degree. A corrective wave 2 unfolded as a zigzag, with wave ((a)) declining to $119.88. Wave ((b)) rebounded to $121.35, and wave ((c)) bottomed at $115.06. As long as AMD holds above $107.10, expect one more upward leg to complete wave 3. Then it should be followed by a wave 4 pullback and a final push in wave (5) to conclude the cycle from the April 10 low. This structured advance underscores AMD’s bullish outlook, with key support levels guiding its near-term trajectory.
From the wave (4) low, the subdivision of wave (5) began with wave ((i)) reaching $117.05, followed by a dip in wave ((ii)) to $108.62. The rally resumed in wave ((iii)), peaking at $119.40, with wave ((iv)) retracing to $114.25. The final leg, wave ((v)), concluded at $124.60, completing wave 1 of a higher degree. A corrective wave 2 unfolded as a zigzag, with wave ((a)) declining to $119.88. Wave ((b)) rebounded to $121.35, and wave ((c)) bottomed at $115.06. As long as AMD holds above $107.10, expect one more upward leg to complete wave 3. Then it should be followed by a wave 4 pullback and a final push in wave (5) to conclude the cycle from the April 10 low. This structured advance underscores AMD’s bullish outlook, with key support levels guiding its near-term trajectory.
14 days trial --> elliottwave-forecast.com/plan-trial/ and get Accurate & timely Elliott Wave Forecasts of 78 instruments. Webinars, Chat Room, Stocks/Forex/Indices Signals & more.
Disclaimer
The information and publications are not meant to be, and do not constitute, financial, investment, trading, or other types of advice or recommendations supplied or endorsed by TradingView. Read more in the Terms of Use.