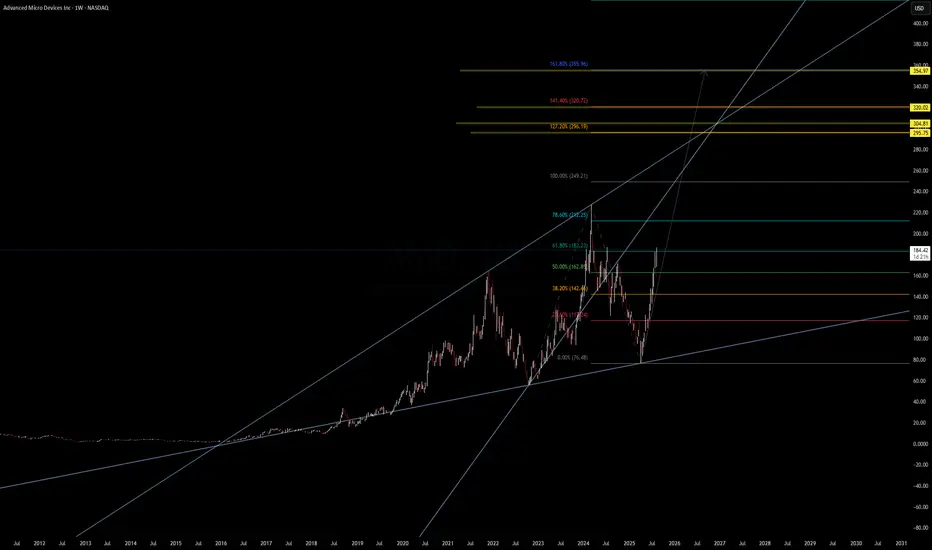
AMD | Weekly Macro Structure – Eyeing Major Fib Extensions 🚀
AMD has broken above the 61.8% retracement ($183.23) from its previous cycle and is pushing toward the 78.6% zone ($212.25). This breakout from the mid-channel region signals strong bullish momentum with clean room toward upper Fibonacci extensions.
Key Levels:
Fib Retracements:
61.8% – $183.23 ✅ (broken)
78.6% – $212.25 (next resistance)
Fib Extensions:
127.2% – $296.19
141.4% – $320.02
161.8% – $355.96
200% – $421.94
227.2% – $486.92
Trend Structure:
Long-term ascending channel intact since 2018.
Recent bounce from macro trendline near $76 set a higher low.
Breakout path projects a potential test of $300+ in the mid-term if momentum holds.
Macro & Catalysts:
AI/data center growth remains a key revenue driver, though export restrictions to China could slow short-term upside.
Positive sentiment from recent product launches and strong PC chip recovery.
Watch For:
Pullback retest of $183 support before continuation.
Weekly close above $212 for momentum confirmation toward $250–$320.
📊 Not financial advice. Chart for educational purposes.
Disclaimer
The information and publications are not meant to be, and do not constitute, financial, investment, trading, or other types of advice or recommendations supplied or endorsed by TradingView. Read more in the Terms of Use.
Disclaimer
The information and publications are not meant to be, and do not constitute, financial, investment, trading, or other types of advice or recommendations supplied or endorsed by TradingView. Read more in the Terms of Use.