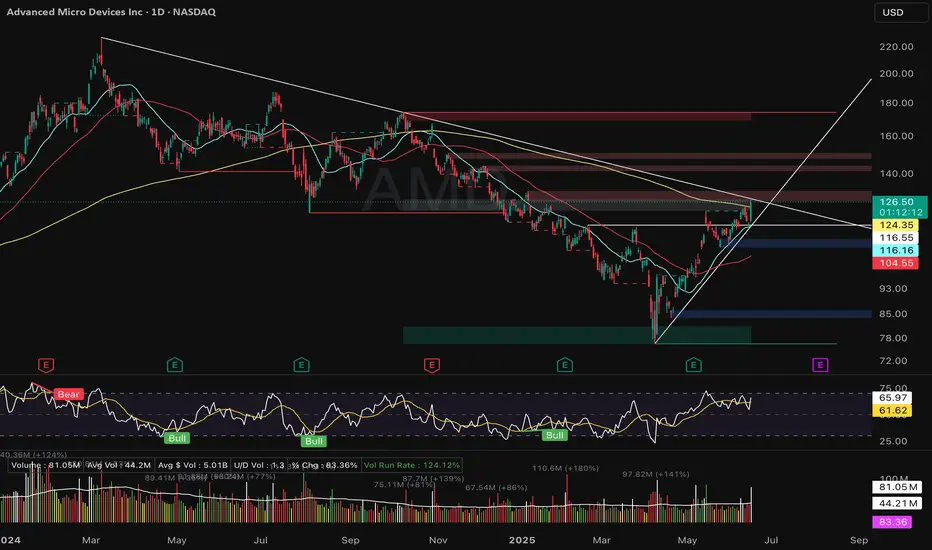
This marks a clear character change, but not yet a setup. Price stalled into multi-quarter trendline resistance around 128–130.
No pivot, no contraction — just strength into supply. Still needs to consolidate below trendline resistance for a valid trade.
Key Levels:
• Resistance: 130 / 145
• Support: 124.35 (breakout zone), 116.55 (MA stack)
• Watch for: Tight coil, volume dry-up, pivot pattern formation
Not chasing — watching for structure. Patience is a position.
📉 Weekly chart also reclaimed 30-week MA for the first time since Nov ’24.
#AMD #technicalanalysis #breakoutwatch #tradingview
Disclaimer
The information and publications are not meant to be, and do not constitute, financial, investment, trading, or other types of advice or recommendations supplied or endorsed by TradingView. Read more in the Terms of Use.
Disclaimer
The information and publications are not meant to be, and do not constitute, financial, investment, trading, or other types of advice or recommendations supplied or endorsed by TradingView. Read more in the Terms of Use.