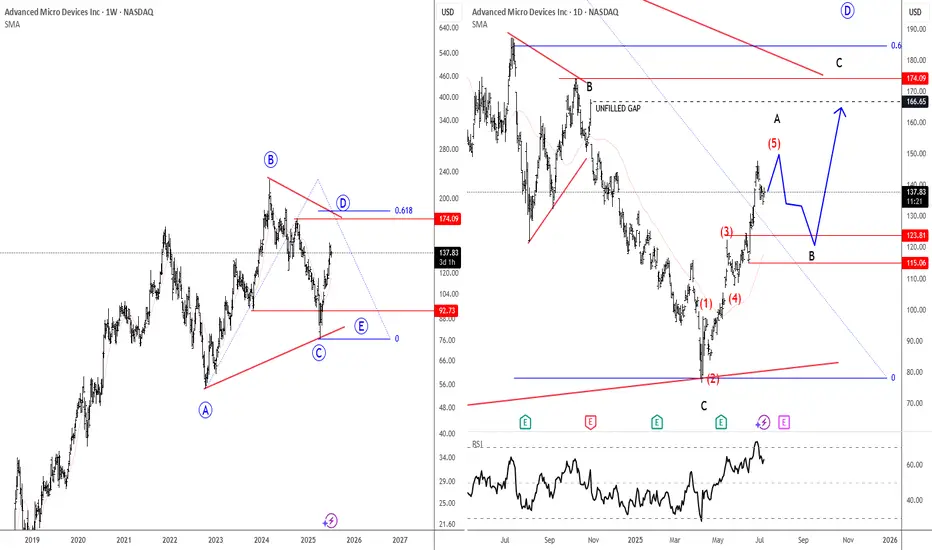
AMD has seen a deep retracement from its 2024 highs, but it now looks like the stock is trying to stabilize. However, a straight push to new highs may not be likely just yet, as we’re still tracking an ongoing running triangle—an A-B-C-D-E pattern.
Looking at the daily chart, things do look promising for more upside into wave D as we’re seeing a clean five-wave move up on the lower time frame, suggesting we may be in wave A of that D-leg. After a pullback, there could be some very interesting opportunities on the long side.
Support levels on dips to watch are around 115 and 123, while upward projections for this three-wave D-leg rally could be toward the 166 gap area and potentially 185.
Highlights:
Direction: Up after pullback
Support: 115–123
Upside projection: 166 (gap), 185
Grega
US Single STOCKS (FREE Access), FX, Crypto
👉Explore Our Services @ wavetraders.com/elliott-wave-plans/
Learn Elliott Waves
👉 wavetraders.com/academy/
Newsletter Sign up
👉 bit.ly/3FVPVzO
👉Explore Our Services @ wavetraders.com/elliott-wave-plans/
Learn Elliott Waves
👉 wavetraders.com/academy/
Newsletter Sign up
👉 bit.ly/3FVPVzO
Related publications
Disclaimer
The information and publications are not meant to be, and do not constitute, financial, investment, trading, or other types of advice or recommendations supplied or endorsed by TradingView. Read more in the Terms of Use.