🔷 📝 AMD Analysis – GEN Methodology & Fibonacci Projection  AMD
AMD
✅ Chart Technique:
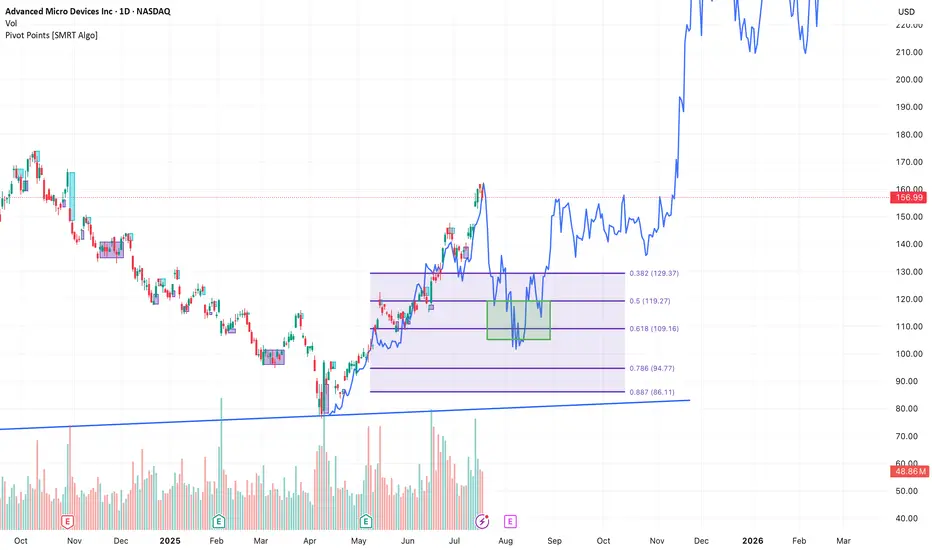
The blue overlay represents a historical price pattern (GEN Projection) applied to the current AMD chart using Bar Pattern Projection.
This technique forecasts potential timing and price movement based on similar past structures.
✅ Fibonacci Retracement (purple levels):
After the July high, a correction into the Golden Zone (0.618 at $109.16) was expected.
The current price is hovering around the 0.5–0.382 retracement levels ($119–129), suggesting potential support or a mid-term consolidation.
✅ Green box:
Marks a liquidity zone or accumulation area where the price may form a local bottom before continuation.
✅ Overall idea:
If the GEN Projection plays out, AMD could consolidate here before a strong rally towards new highs ($200+) in the coming months.
Invalidation: A clean break and daily close below the 0.618 Fibonacci ($109) would weaken this bullish scenario.
✅ Chart Technique:
The blue overlay represents a historical price pattern (GEN Projection) applied to the current AMD chart using Bar Pattern Projection.
This technique forecasts potential timing and price movement based on similar past structures.
✅ Fibonacci Retracement (purple levels):
After the July high, a correction into the Golden Zone (0.618 at $109.16) was expected.
The current price is hovering around the 0.5–0.382 retracement levels ($119–129), suggesting potential support or a mid-term consolidation.
✅ Green box:
Marks a liquidity zone or accumulation area where the price may form a local bottom before continuation.
✅ Overall idea:
If the GEN Projection plays out, AMD could consolidate here before a strong rally towards new highs ($200+) in the coming months.
Invalidation: A clean break and daily close below the 0.618 Fibonacci ($109) would weaken this bullish scenario.
Disclaimer
The information and publications are not meant to be, and do not constitute, financial, investment, trading, or other types of advice or recommendations supplied or endorsed by TradingView. Read more in the Terms of Use.
Disclaimer
The information and publications are not meant to be, and do not constitute, financial, investment, trading, or other types of advice or recommendations supplied or endorsed by TradingView. Read more in the Terms of Use.