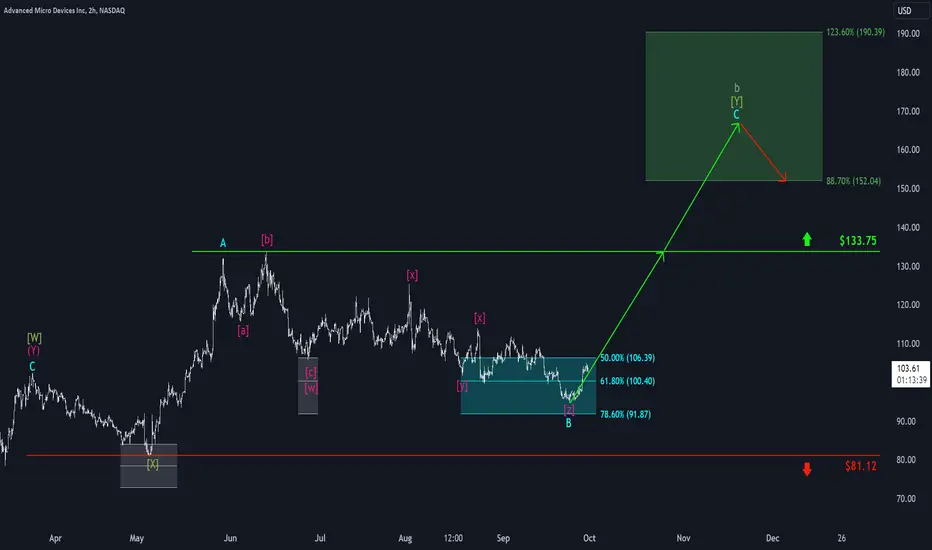
Over the past few weeks, AMD stock has again visited lower levels below the 61.80% retracement in the turquoise target zone between $106.39 and $91.87. However, as of this week, the stock has been moving decisively higher, and we now believe that the bottom of the turquoise wave B has been completed. As a result, the price should now be in the turquoise wave C, which will take it higher. First, the resistance at $133.75 should be breached, ensuring further upside momentum. After that, the rise should continue significantly. The green target area between $152.04 and $190.39 is where we expect this wave's completion and, thus, the end of superior wave b in gray.
📊 Free daily market insights combining macro + Elliott Wave analysis
🚀 Spot trends early with momentum, sentiment & price structure
🌐 Join thousands trading smarter - full free analyses at dailymarketupdate.com
🚀 Spot trends early with momentum, sentiment & price structure
🌐 Join thousands trading smarter - full free analyses at dailymarketupdate.com
Related publications
Disclaimer
The information and publications are not meant to be, and do not constitute, financial, investment, trading, or other types of advice or recommendations supplied or endorsed by TradingView. Read more in the Terms of Use.