🧠 Head and Shoulders Pattern
- This chart shows a classic head and shoulders formation:
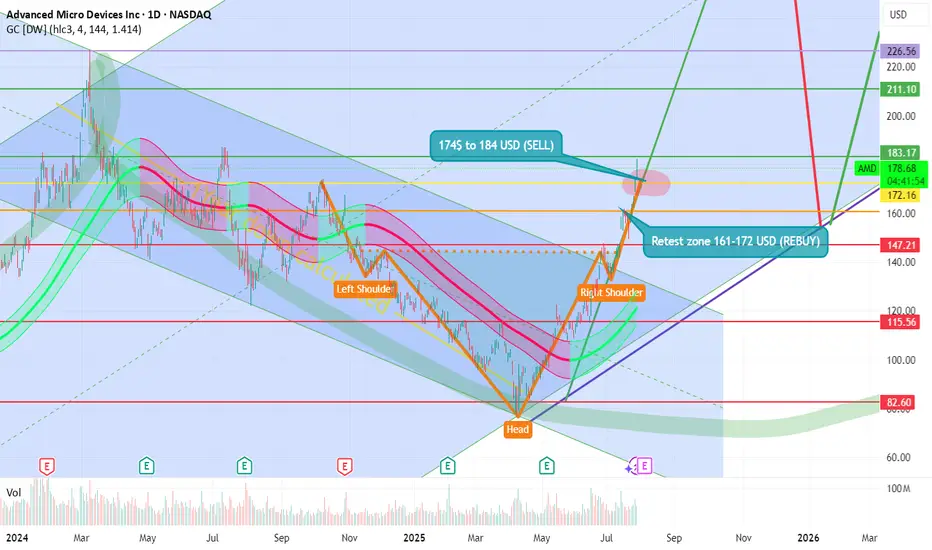
- Left Shoulder: First peak around ~$172
- Head: Highest peak near ~$183
- Right Shoulder: Second peak returning to ~$178
🔎 This pattern often signals a potential reversal in an uptrend—investors might expect selling pressure ahead if confirmed.
📉 Sell Zone 📍
- 💸 Highlighted zone: $174–$184 USD
- 🚨 Considered an overbought region—ideal for profit-taking or short positions
Current price: $178.82 USD 📌 (+$5.16 / +2.97%)
This price lands right in the sell zone, suggesting caution as upside might be limited short-term.
🔄 Retest Zone (Support) 📍
- 🛡️ Marked between $161–$172 USD
- 🤝 A potential buy zone where price could stabilize or rebound
If AMD pulls back, this is where buyers might re-enter the market for long positions.
🧪 Trend Indicators & Sentiment
- 📈 Recent bullish move (+2.97%) shows strength—but could also be testing resistance
- 🔁 Watch for confirmation of either a breakout above $184 or a pullback to retest support
- 🧭 Overall sentiment looks cautiously optimistic but technically fragile near the upper resistance
🧠 Final Thoughts 💬
This chart analysis suggests AMD may be approaching a turning point. Traders should keep an eye on volume, macro tech trends, and market reactions in the coming sessions.
The information and publications are not meant to be, and do not constitute, financial, investment, trading, or other types of advice or recommendations.
Thank you!
Subcribe to TSXGanG! 🧠🎯
Disclaimer
The information and publications are not meant to be, and do not constitute, financial, investment, trading, or other types of advice or recommendations supplied or endorsed by TradingView. Read more in the Terms of Use.
Disclaimer
The information and publications are not meant to be, and do not constitute, financial, investment, trading, or other types of advice or recommendations supplied or endorsed by TradingView. Read more in the Terms of Use.