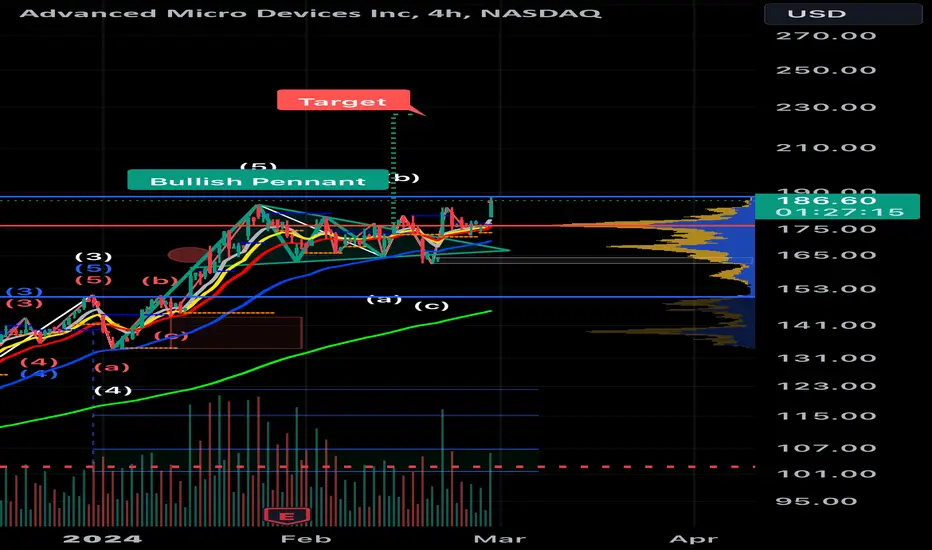
The 4-hour chart for AMD shows an interesting development with a potential breakout from a bullish pennant pattern. Based on technical analysis, if this breakout is confirmed, it could theoretically indicate a move beyond $226. Updated.
Trade active
Note
Getting there.USDT: 0xd3787d843Cf915E5475119459B34b6429827c297
Disclaimer
The information and publications are not meant to be, and do not constitute, financial, investment, trading, or other types of advice or recommendations supplied or endorsed by TradingView. Read more in the Terms of Use.
USDT: 0xd3787d843Cf915E5475119459B34b6429827c297
Disclaimer
The information and publications are not meant to be, and do not constitute, financial, investment, trading, or other types of advice or recommendations supplied or endorsed by TradingView. Read more in the Terms of Use.