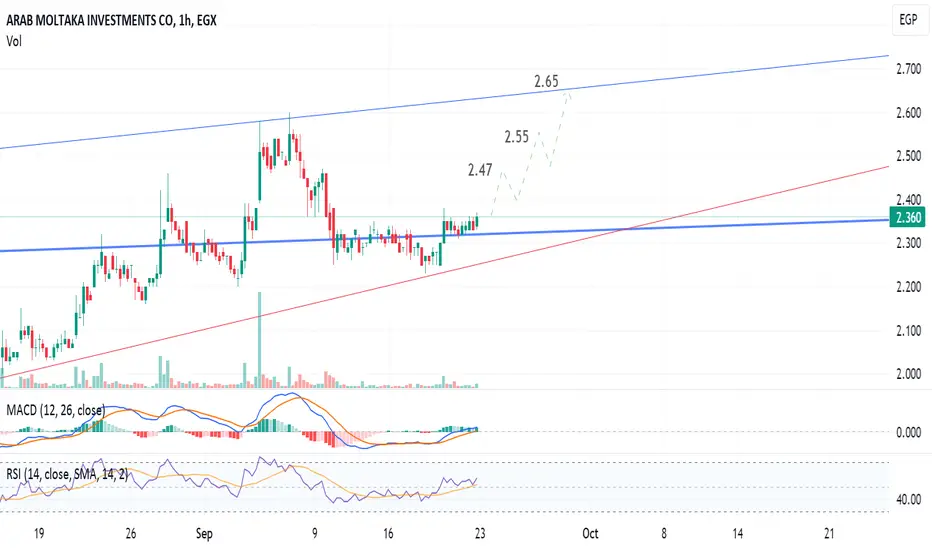
1-hour chart, the stock  AMIA is forming a chart pattern, and is supposed to hit the upper line at around 2.65 within few days.
Resistance levels at 2.47 and 2.55
Technical indicators RSI and MACD are supporting this view.
Stop loss should be considered below 2.31
Resistance levels at 2.47 and 2.55
Technical indicators RSI and MACD are supporting this view.
Stop loss should be considered below 2.31
Disclaimer
The information and publications are not meant to be, and do not constitute, financial, investment, trading, or other types of advice or recommendations supplied or endorsed by TradingView. Read more in the Terms of Use.
Disclaimer
The information and publications are not meant to be, and do not constitute, financial, investment, trading, or other types of advice or recommendations supplied or endorsed by TradingView. Read more in the Terms of Use.