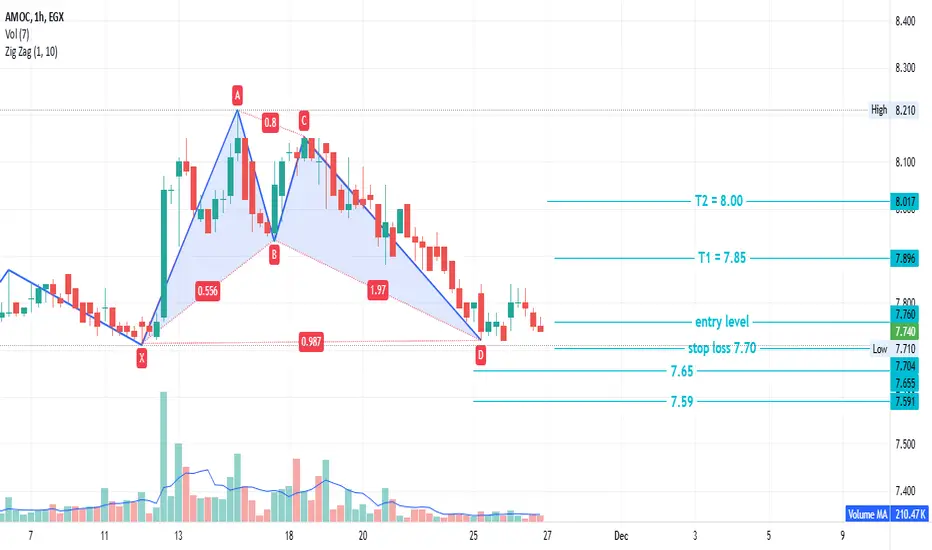
According to below chart there is gartly pattern at time frame 1 hour
entry level from 7.71 to 7.77
stop loss 7.70 ( closing 1 hour )
target 1 = 7.85
target 2 = 8.00
may the prices go down to 7.65 and 7.59 then going up to achieve the below targets that's according to anther pattern but on time frame 15m
closing under 7.65 may go to 7.12
note : this data according to time frame 1 hour
note : EGX30 is negative
Its not an advice for investing only my vision according to the data on chart
Please consult your account manager before investing
Thanks and good luck
Disclaimer
The information and publications are not meant to be, and do not constitute, financial, investment, trading, or other types of advice or recommendations supplied or endorsed by TradingView. Read more in the Terms of Use.
Disclaimer
The information and publications are not meant to be, and do not constitute, financial, investment, trading, or other types of advice or recommendations supplied or endorsed by TradingView. Read more in the Terms of Use.