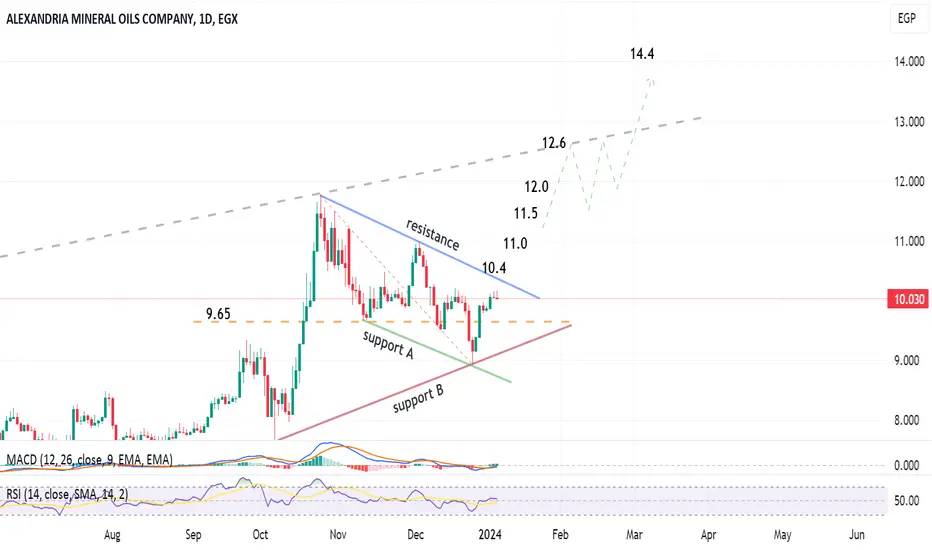
Daily chart, AMOC is trading in a descending channel, and it seems a chart pattern will be formed - a flag / inside a triangle.
After crossing the resistance (at 10.35 - 10.4), the target will be 12 and 12.6 , then some correction may happen at 12.6 before reaching the target 14.4
Stop loss below 9.6 to be considered.
After crossing the resistance (at 10.35 - 10.4), the target will be 12 and 12.6 , then some correction may happen at 12.6 before reaching the target 14.4
Stop loss below 9.6 to be considered.
Trade active
The chart pattern has been completed..Related publications
Disclaimer
The information and publications are not meant to be, and do not constitute, financial, investment, trading, or other types of advice or recommendations supplied or endorsed by TradingView. Read more in the Terms of Use.
Related publications
Disclaimer
The information and publications are not meant to be, and do not constitute, financial, investment, trading, or other types of advice or recommendations supplied or endorsed by TradingView. Read more in the Terms of Use.