Some reference notes on the chart. Its all about being able to identify when and where the institutions entered or exited.
Smart money (SM), Whales, big banks, institutional investors... are synonymous. Depending on your methodology you may here some variation of this. The name isn't important but the volume is! Your volume indicator tells you exactly what they are doing (and not doing).
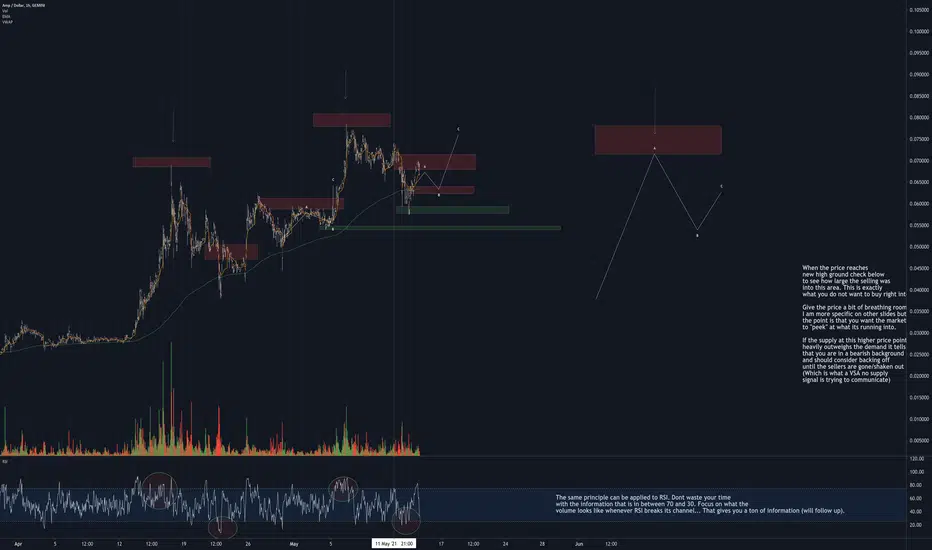
Here you can see quite pronounced spikes in volume and you can also see the resulting price action (effort versus result).
For simplicity notice the supply pressure in the areas that I placed a red box. This example shows numerous examples of the resulting price action once all of the weak hands are shaken out. Obviously our goal is to identify the point in which price is ready to mark up (or mark down).
Try to allow the market to test these areas before you enter. If you open your chart and see your coin up 10+ percent and everything is green... calm down. Never rush an entry. Even if you miss this one it IS going to reset. Whats cool about BTC is it doesn't matter how high it goes if you are actively trading it (holding/investing is different). You can have partial positions so even if it goes to 100K tomorrow so what if you missed it? Look no further than to the left of your chart and notice how price moves in waves and in cycles. Our job is to target the common areas that we expect price to visit and we can.
There is a logic and a general template to chart analysis. How far you want to take it is up to you. But don't give up on it if you aren't having any luck right now. Take a step back. 99.999 percent of the instructional information on youtube is crazy. Ive been there. It was very difficult to find good information and put it together. After i was introduced to the Wyckoff and VSA material (thanks to btc trading challenge) it opened up the door for me in my understanding of whats really going on. The Pete faders stuff really puts all the concepts together coherently and provides some insight into risk management, targeting etc.
Check out these resources (all free stuff)
Sources of education:
Richard Wyckoff
Tom Williams Volume spread analysis VSA/ Master the Markets
Pete Faders VSA*
Read the ticker dot com
Wyckoff analytics
PsychFX
MentFX
Dee Nixon
Avoid buying into weakness/supply/resistance
Avoid selling into strength/demand/support
Avoid entry when price is in middle of a range (phase B)
Smart money (SM), Whales, big banks, institutional investors... are synonymous. Depending on your methodology you may here some variation of this. The name isn't important but the volume is! Your volume indicator tells you exactly what they are doing (and not doing).
Here you can see quite pronounced spikes in volume and you can also see the resulting price action (effort versus result).
For simplicity notice the supply pressure in the areas that I placed a red box. This example shows numerous examples of the resulting price action once all of the weak hands are shaken out. Obviously our goal is to identify the point in which price is ready to mark up (or mark down).
Try to allow the market to test these areas before you enter. If you open your chart and see your coin up 10+ percent and everything is green... calm down. Never rush an entry. Even if you miss this one it IS going to reset. Whats cool about BTC is it doesn't matter how high it goes if you are actively trading it (holding/investing is different). You can have partial positions so even if it goes to 100K tomorrow so what if you missed it? Look no further than to the left of your chart and notice how price moves in waves and in cycles. Our job is to target the common areas that we expect price to visit and we can.
There is a logic and a general template to chart analysis. How far you want to take it is up to you. But don't give up on it if you aren't having any luck right now. Take a step back. 99.999 percent of the instructional information on youtube is crazy. Ive been there. It was very difficult to find good information and put it together. After i was introduced to the Wyckoff and VSA material (thanks to btc trading challenge) it opened up the door for me in my understanding of whats really going on. The Pete faders stuff really puts all the concepts together coherently and provides some insight into risk management, targeting etc.
Check out these resources (all free stuff)
Sources of education:
Richard Wyckoff
Tom Williams Volume spread analysis VSA/ Master the Markets
Pete Faders VSA*
Read the ticker dot com
Wyckoff analytics
PsychFX
MentFX
Dee Nixon
Avoid buying into weakness/supply/resistance
Avoid selling into strength/demand/support
Avoid entry when price is in middle of a range (phase B)
Disclaimer
The information and publications are not meant to be, and do not constitute, financial, investment, trading, or other types of advice or recommendations supplied or endorsed by TradingView. Read more in the Terms of Use.
Disclaimer
The information and publications are not meant to be, and do not constitute, financial, investment, trading, or other types of advice or recommendations supplied or endorsed by TradingView. Read more in the Terms of Use.