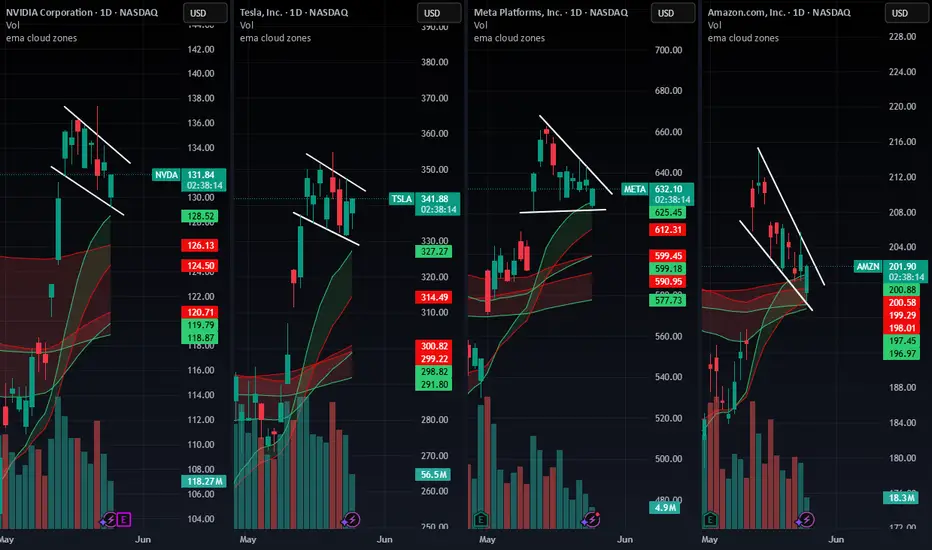
📊 Symmetrical triangle formations are building across these tech giants — and volatility is compressing.
🔍 What to watch:
📈 Breakout above upper trendline = bullish momentum
📉 Breakdown below lower trendline = bearish confirmation
📉 RSI on NVDA is at 73.04 = overbought warning
⚠️NVDA earnings drop May 28, could be a trigger for resolution
These coils don’t last forever. Price is building pressure — and one strong candle could break the dam.
Stay sharp, and tighten your stops.
This is where risk management matters most.
👇 Which side are you betting on — breakout or breakdown?
🔍 What to watch:
📈 Breakout above upper trendline = bullish momentum
📉 Breakdown below lower trendline = bearish confirmation
📉 RSI on
⚠️
These coils don’t last forever. Price is building pressure — and one strong candle could break the dam.
Stay sharp, and tighten your stops.
This is where risk management matters most.
👇 Which side are you betting on — breakout or breakdown?
Disclaimer
The information and publications are not meant to be, and do not constitute, financial, investment, trading, or other types of advice or recommendations supplied or endorsed by TradingView. Read more in the Terms of Use.
Disclaimer
The information and publications are not meant to be, and do not constitute, financial, investment, trading, or other types of advice or recommendations supplied or endorsed by TradingView. Read more in the Terms of Use.