🔮 GEX (Gamma Exposure) – Options Flow Analysis
🚩 Heavy PUT Pressure at 179–175
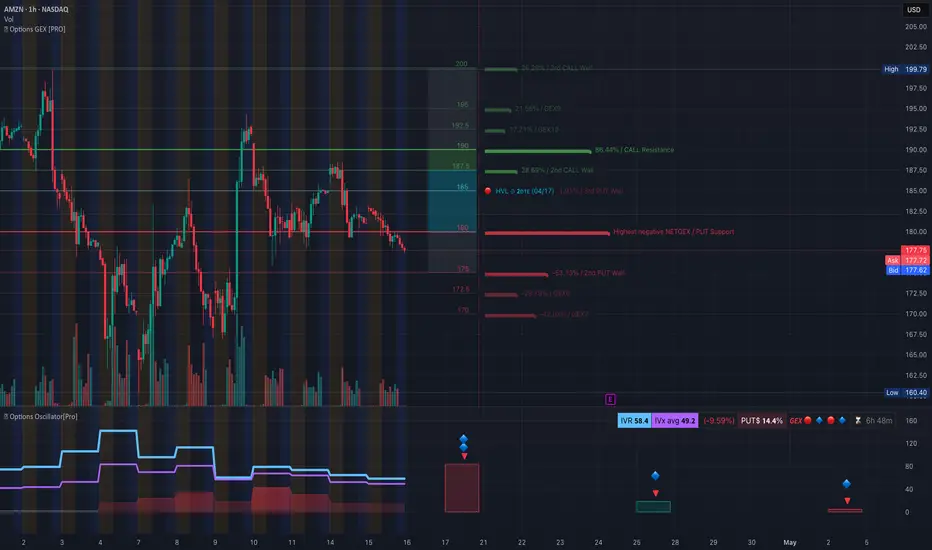
* AMZN is trading just above its highest negative GEX zone at 179.30, which marks the top of a dense PUT support zone.
* A breakdown below 179 may trigger aggressive dealer hedging and push price swiftly to 175, then 172.5 where second PUT Wall is located.
* Further support sits around 170, with a deeper PUT wall at 166.94.
📈 Resistance Cluster at 185–190
* Above price, multiple CALL resistance levels stack tightly from 185 → 187.5 → 190.
* The 86.44% CALL Resistance at 190 marks the gamma ceiling — dealers are short CALLs and likely to hedge against rallies here, making upside stickiness high.
📊 GEX Sentiment Summary:
* IVR: 58.4 → Volatility is elevated, traders are hedging more aggressively.
* IVx: 49.2, down –9.59%, shows softening vol despite rising risk — hinting a potential vol crush if breakdowns continue.
* PUTs only 14.4%, but concentrated around current price levels — enough to trigger sharp gamma-driven moves on breakdowns.
🎯 GEX Implications:
* Bearish trigger if AMZN loses 179 — opens room to 175, 172.5, possibly 170–166.9.
* Bullish bounce only holds if 179 defends and price reclaims 183+, but faces strong CALL resistance near 190.
🕰️ Technical Analysis – 1 Hour Chart

Trend Analysis:
* AMZN broke below both VWAP and rising support line, confirming bearish short-term trend.
* Price is compressing inside a descending triangle, now threatening a full breakdown.
Indicators:
* MACD: Bearish crossover is holding, with no bullish momentum yet.
* RSI: Falling under 40, no divergence forming — confirms sellers still in control.
Key Zones to Watch:
* Support: 179 → 175 → 172.5 → 170 → 166.94
* Resistance: 183.5 → 185 → 188.42 → 190
🧠 Final Thoughts:
AMZN is perched right above a gamma cliff, with GEX showing dominant PUT support that could flip into downside acceleration on any weakness under 179. CALL resistance above is dense and unrelenting, especially ahead of earnings.
Bulls need a sharp reclaim of 183+ to neutralize risk — otherwise, this chart favors continuation lower into the mid-170s.
This analysis is for educational purposes only and does not constitute financial advice. Always trade with proper risk management and let price confirm your bias.
🚩 Heavy PUT Pressure at 179–175
* AMZN is trading just above its highest negative GEX zone at 179.30, which marks the top of a dense PUT support zone.
* A breakdown below 179 may trigger aggressive dealer hedging and push price swiftly to 175, then 172.5 where second PUT Wall is located.
* Further support sits around 170, with a deeper PUT wall at 166.94.
📈 Resistance Cluster at 185–190
* Above price, multiple CALL resistance levels stack tightly from 185 → 187.5 → 190.
* The 86.44% CALL Resistance at 190 marks the gamma ceiling — dealers are short CALLs and likely to hedge against rallies here, making upside stickiness high.
📊 GEX Sentiment Summary:
* IVR: 58.4 → Volatility is elevated, traders are hedging more aggressively.
* IVx: 49.2, down –9.59%, shows softening vol despite rising risk — hinting a potential vol crush if breakdowns continue.
* PUTs only 14.4%, but concentrated around current price levels — enough to trigger sharp gamma-driven moves on breakdowns.
🎯 GEX Implications:
* Bearish trigger if AMZN loses 179 — opens room to 175, 172.5, possibly 170–166.9.
* Bullish bounce only holds if 179 defends and price reclaims 183+, but faces strong CALL resistance near 190.
🕰️ Technical Analysis – 1 Hour Chart
Trend Analysis:
* AMZN broke below both VWAP and rising support line, confirming bearish short-term trend.
* Price is compressing inside a descending triangle, now threatening a full breakdown.
Indicators:
* MACD: Bearish crossover is holding, with no bullish momentum yet.
* RSI: Falling under 40, no divergence forming — confirms sellers still in control.
Key Zones to Watch:
* Support: 179 → 175 → 172.5 → 170 → 166.94
* Resistance: 183.5 → 185 → 188.42 → 190
🧠 Final Thoughts:
AMZN is perched right above a gamma cliff, with GEX showing dominant PUT support that could flip into downside acceleration on any weakness under 179. CALL resistance above is dense and unrelenting, especially ahead of earnings.
Bulls need a sharp reclaim of 183+ to neutralize risk — otherwise, this chart favors continuation lower into the mid-170s.
This analysis is for educational purposes only and does not constitute financial advice. Always trade with proper risk management and let price confirm your bias.
Disclaimer
The information and publications are not meant to be, and do not constitute, financial, investment, trading, or other types of advice or recommendations supplied or endorsed by TradingView. Read more in the Terms of Use.
Disclaimer
The information and publications are not meant to be, and do not constitute, financial, investment, trading, or other types of advice or recommendations supplied or endorsed by TradingView. Read more in the Terms of Use.